Safeway 1998 Annual Report Download - page 4
Download and view the complete annual report
Please find page 4 of the 1998 Safeway annual report below. You can navigate through the pages in the report by either clicking on the pages listed below, or by using the keyword search tool below to find specific information within the annual report.-
 1
1 -
 2
2 -
 3
3 -
 4
4 -
 5
5 -
 6
6 -
 7
7 -
 8
8 -
 9
9 -
 10
10 -
 11
11 -
 12
12 -
 13
13 -
 14
14 -
 15
15 -
16
-
17
-
18
-
19
-
20
-
21
-
22
-
23
-
24
-
25
-
26
-
27
-
28
-
29
-
30
-
31
-
32
-
33
-
34
-
35
-
36
-
37
-
38
-
39
-
40
-
41
-
42
-
43
-
44
 |
 |

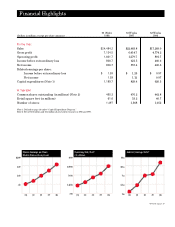
Financial Highlights
52 Weeks 53 Weeks 52 Weeks
(Dollars in millions, except per-share amounts) 1998 1997 1996
For the Year:
Sales $24,484.2 $22,483.8 $17,269.0
Gross profit 7,124.5 6,414.7 4,774.2
Operating profit 1,601.7 1,279.7 891.7
Income before extraordinary loss 806.7 621.5 460.6
Net income 806.7 557.4 460.6
Diluted earnings per share:
Income before extraordinary loss $ 1.59 $ 1.25 $ 0.97
Net income 1.59 1.12 0.97
Capital expenditures (Note 1) 1,189.7 829.4 620.3
At Year-End:
Common shares outstanding (in millions) (Note 2) 490.3 476.2 442.8
Retail square feet (in millions) 61.6 53.2 40.7
Number of stores 1,497 1,368 1,052
Note 1: Defined on page 14 under “Capital Expenditure Program.”
Note 2: Net of 60.6 million and 61.2 million shares held in treasury in 1998 and 1997.
*Defined on page 17