Safeway 1998 Annual Report Download - page 28
Download and view the complete annual report
Please find page 28 of the 1998 Safeway annual report below. You can navigate through the pages in the report by either clicking on the pages listed below, or by using the keyword search tool below to find specific information within the annual report.-
 1
1 -
2
-
3
-
4
-
5
-
6
-
7
-
8
-
9
-
10
-
11
-
12
-
13
-
14
-
15
-
16
-
17
-
 18
18 -
 19
19 -
 20
20 -
 21
21 -
 22
22 -
 23
23 -
 24
24 -
 25
25 -
 26
26 -
 27
27 -
 28
28 -
 29
29 -
 30
30 -
 31
31 -
 32
32 -
 33
33 -
 34
34 -
 35
35 -
 36
36 -
 37
37 -
 38
38 -
39
-
40
-
41
-
42
-
43
-
44
 |
 |

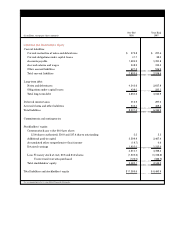
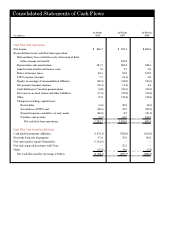
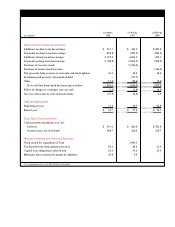
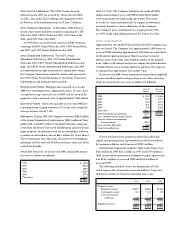
Notes to Consolidated Financial Statements
Note A: The Company and Significant Accounting Policies
The Company Safeway Inc. (“Safeway” or the “Company”)
is one of the largest food and drug chains in North America,
with 1,497 stores as of year-end 1998. Safeway’s U.S. retail
operations are located principally in nort h e r n Californ i a ,
s o u t h e rn California, Oregon, Washington, Colorado, Arizona,
the Chicago metropolitan area and the Mid-Atlantic region .T h e
C o m p a n y ’s Canadian retail operations are located principally
in British Columbia, Alberta and Manitoba/Saskatchewan.
In support of its retail operations, the Company has an
extensive network of distribution, manufacturing and food
p rocessing facilities.
As discussed in Note B, in November 1998 the Company
acquired Dominick’s Supermarkets, Inc. (“Dominick’s”) by
p u rchasing all of the outstanding shares of Dominick’s for
$49 cash per share, or a total of approximately $1.2 billion
(the “Dominick’s Acquisition”). The acquisition was accounted
for as a purchase and Dominick’s operating results have been
consolidated with Safeway’s since approximately midway
through the fourth quarter of 1998.
Also discussed in Note B, in August 1998 Safeway and
C a rr-Gottstein Foods Co. (“Carrs”) signed a definitive merg e r
a g reement in which Safeway will acquire all of the outstanding
s h a res of Carrs for $12.50 cash per share, or a total of appro x i-
mately $110 million (the “Carrs Acquisition”).
In April 1997, Safeway completed a merger with The Vo n s
Companies, Inc. (“Vons”) pursuant to which the Company
issued 83.2 million shares of Safeway common stock for all
of the shares of Vons common stock that it did not already
own (the “Vons Merger”). Beginning in the second quarter
of 1997, Safeway’s consolidated financial statements include
Vons’ financial results.
In addition to these operations, the Company has a 49%
ownership interest in Casa Ley, S.A. de C.V. (“Casa Ley”),
which operates 77 food and general merchandise stores in
western Mexico.
Basis of Consolidation The consolidated financial statements
include Safeway Inc., a Delaware corporation, and all majority-
owned subsidiaries. All significant intercompany transactions
and balances have been eliminated in consolidation. The
C o m p a n y ’s investment in Casa Ley is re p o r ted using the
equity method. Prior to the Vons Merger in the second quarter
of 1997, the Company’s investment in Vons was reported using
the equity method.
Fiscal Year The Company’s fiscal year ends on the Saturday
nearest December 31. The last three fiscal years consist
of the 52-week period ended January 2, 1999, the 53-week
period ended January 3, 1998 and 52-week period ended
December 28, 1996.
Use of Estimates The preparation of financial statements in
c o n f o rmity with generally accepted accounting principles
re q u i res management to make estimates and assumptions
that affect the re p o rted amounts of assets, liabilities, re v e n u e s
and expenses, as well as the disclosure of contingent assets
and liabilities. Actual results could differ from those estimates.
Translation of Foreign Currencies Assets and liabilities of the
C o m p a n y ’s Canadian subsidiaries and Casa Ley are translated
into U.S. dollars at year-end rates of exchange, and income and
expenses are translated at average rates during the year.
Adjustments resulting from translating financial statements
into U.S. dollars are re p o rted, net of applicable income taxes,
as a separate component of comprehensive income in the
Statements of Stockholders’ Equity and Comprehensive Income.
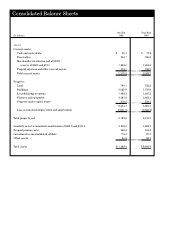
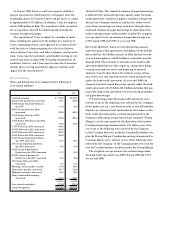
Merchandise Inventories M e rchandise inventory of $1,110 million
at year-end 1998 and $1,118 million at year-end 1997 is valued at
the lower of cost on a last-in, first-out (“LIFO”) basis or market
value. Such LIFO inventory had a replacement or current cost
of $1,190 million at year-end 1998 and $1,191 million at year- e n d
1997. Liquidations of LIFO layers during the three years
re p o rted did not have a significant effect on the results of oper-
ations. All remaining inventory is valued at the lower of cost on
a first-in, first-out (“FIFO”) basis or market value. The FIFO
cost of inventory approximates replacement or current cost.
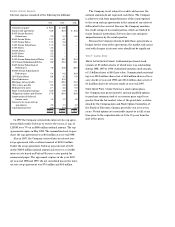
Property and Depreciation P ro p e rty is stated at cost. Depre c i a t i o n
expense on buildings and equipment is computed on the straight-
line method using the following lives:
P ro p e rty under capital leases and leasehold impro v ements
are amortized on a straight-line basis over the shorter of the
remaining terms of the lease or the estimated useful lives of
the assets.
Stores and other buildings 10 to 30 years
Fixtures and equipment 3 to 15 years