Safeway 2002 Annual Report Download - page 15
Download and view the complete annual report
Please find page 15 of the 2002 Safeway annual report below. You can navigate through the pages in the report by either clicking on the pages listed below, or by using the keyword search tool below to find specific information within the annual report.-
 1
1 -
2
-
3
-
4
-
 5
5 -
 6
6 -
 7
7 -
 8
8 -
 9
9 -
 10
10 -
 11
11 -
 12
12 -
 13
13 -
 14
14 -
 15
15 -
 16
16 -
 17
17 -
 18
18 -
 19
19 -
 20
20 -
 21
21 -
 22
22 -
 23
23 -
 24
24 -
 25
25 -
26
-
27
-
28
-
29
-
30
-
31
-
32
-
33
-
34
-
35
-
36
-
37
-
38
-
39
-
40
-
41
-
42
-
43
-
44
-
45
-
46
-
47
-
48
-
49
-
50
-
51
-
52
-
53
-
54
-
55
-
56
 |
 |

SAFEWAY INC. 2002 ANNUAL REPORT 13
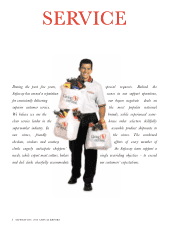
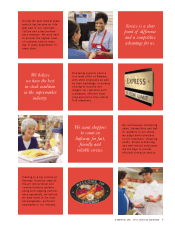
COMPANY IN REVIEW
SAFEWAY INC. AND SUBSIDIARIES
STORES Safeway’s average store size is approximately
44,000 square feet. Safeway’s primary new store prototype is
55,000 square feet and is designed both to accommodate
changing consumer needs and to achieve certain operating
efficiencies. The Company determines the size of a new
store based on a number of considerations, including the
needs of the community the store serves, the location and
site plan, and the estimated return on capital invested.
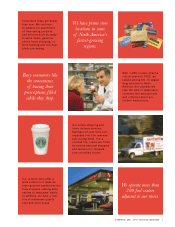
Most stores offer a wide selection of food and general
merchandise and feature a variety of specialty departments
such as bakery, delicatessen, floral, pharmacy, Starbucks cof-
fee shops and adjacent fuel centers.
Safeway continues to operate a number of smaller
stores that also offer an extensive selection of food and
general merchandise, and generally include one or more
specialty departments. These stores remain an important
part of the Company’s store network in smaller communi-
ties and certain other locations where larger stores may not
be feasible because of space limitations and/or communi-
ty needs or restrictions.
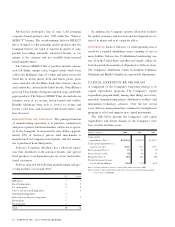
The following table summarizes Safeway’s stores by size
at year-end 2002:
Number Percent
of Stores of Total
Less than 30,000 square feet 290 17%
30,000 to 50,000 763 45
More than 50,000 642 38
Total stores 1,695 100%
STORE OWNERSHIP At year-end 2002, Safeway owned
approximately one-third of its stores and leased its remaining
stores. In recent years, the Company has preferred ownership
because it provides control and flexibility with respect to
financing terms, remodeling, expansions and closures.
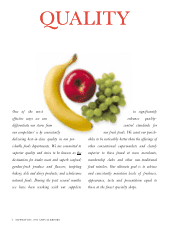
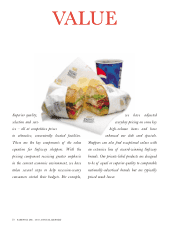
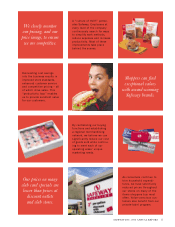
MERCHANDISING Safeway’s operating strategy is to provide
value to its customers by maintaining high store standards
and a wide selection of high quality products at competitive
prices. To provide one-stop shopping for today’s busy shop-
pers, the Company emphasizes high quality produce and
meat, and offers many specialty items through its various
specialty departments.
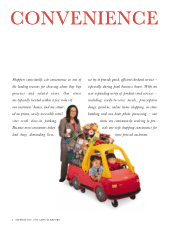
Safeway Inc. (“Safeway” or the “Company”) is one of the
largest food and drug retailers in North America, with 1,695
continuing stores and 113 Dominick’s stores which are held for
sale at year-end 2002. See Planned Disposition of Dominick’s.
The Company’s continuing U.S. retail operations are
located principally in California, Oregon, Washington,
Alaska, Colorado, Arizona, Texas and the Mid-Atlantic
region. The Company’s Canadian retail operations are
located principally in British Columbia, Alberta and
Manitoba/Saskatchewan. In support of its retail operations,
the Company has an extensive network of distribution,
manufacturing and food processing facilities.
Safeway also has a 49% interest in Casa Ley, S.A. de C.V.
(“Casa Ley”) which operates 102 food and general mer-
chandise stores in Western Mexico.
In addition, the Company has a strategic alliance with
and a 52.5% ownership interest in GroceryWorks Holdings,
Inc., an Internet grocer.
PLANNED DISPOSITION OF DOMINICK’S In November
2002, Safeway announced its decision to sell Dominick’s,
which consists of 113 stores, and to exit the Chicago market.
In accordance with SFAS No. 144, “Accounting for the
Impairment or Disposal of Long-Lived Assets,” Dominick’s
operations are presented as a discontinued operation.
Accordingly, Dominick’s results are reflected separately in the Company’s
consolidated financial statements and Dominick’s information is exclud-
ed from the accompanying notes to the consolidated financial statements
and the rest of the financial information included herein, unless other-
wise noted. Sales at Dominick’s were $2.4 billion in 2002, $2.5
billion in 2001 and $2.5 billion in 2000.
In accordance with SFAS No. 144, Dominick’s net assets
and liabilities have been written down to estimated fair
market value. The fair value of Dominick’s was determined
by an independent third-party appraiser which primarily
used the discounted cash flow method and the guideline
company method. The final valuation of Dominick’s is
dependent upon the results of negotiations with the ulti-
mate buyer. Adjustment to the loss on disposition, together
with any related tax effects, will be made when additional
information is known.