Safeway 2002 Annual Report Download - page 30
Download and view the complete annual report
Please find page 30 of the 2002 Safeway annual report below. You can navigate through the pages in the report by either clicking on the pages listed below, or by using the keyword search tool below to find specific information within the annual report.-
 1
1 -
2
-
3
-
4
-
5
-
6
-
7
-
8
-
9
-
10
-
11
-
12
-
13
-
14
-
15
-
16
-
17
-
18
-
19
-
 20
20 -
 21
21 -
 22
22 -
 23
23 -
 24
24 -
 25
25 -
 26
26 -
 27
27 -
 28
28 -
 29
29 -
 30
30 -
 31
31 -
 32
32 -
 33
33 -
 34
34 -
 35
35 -
 36
36 -
 37
37 -
 38
38 -
 39
39 -
 40
40 -
41
-
42
-
43
-
44
-
45
-
46
-
47
-
48
-
49
-
50
-
51
-
52
-
53
-
54
-
55
-
56
 |
 |

28 SAFEWAY INC. 2002 ANNUAL REPORT
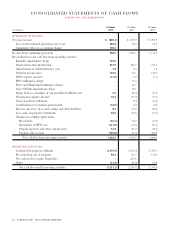
CONSOLIDATED STATEMENTS OF CASH FLOWS
SAFEWAY INC. AND SUBSIDIARIES
52 Weeks 52 Weeks 52 Weeks
(In millions) 2002 2001 2000
OPERATING ACTIVITIES:
Net (loss) income $ (828.1) $ 1,253.9 $ 1,091.9
Loss on discontinued operations, net of tax 696.6 32.8 62.3
Cumulative effect of accounting change 700.0 ––
Income from continuing operations 568.5 1,286.7 1,154.2
Reconciliation to net cash flow from operating activities:
Randall’s impairment charge 704.2 ––
Depreciation and amortization 812.5 826.7 727.6
Amortization of deferred finance costs 7.8 8.0 7.0
Deferred income taxes 135.6 51.1 143.2
LIFO expense (income) (17.6) 2.2 (1.1)
FBO bankruptcy charge –51.0 –
Furr’s and Homeland bankruptcy charge –42.7 –
GroceryWorks impairment charge –30.1 –
Equity in losses (earnings) of unconsolidated affiliates, net 0.2 (20.2) (31.2)
Net pension expense (income) 30.3 (27.3) (77.3)
Gain on pension settlement –(9.3) (15.0)
Contributions to Canadian pension plan (32.0) (3.5) (0.6)
Increase (decrease) in accrued claims and other liabilities 8.3 23.0 (46.9)
Loss (gain) on property retirements 26.2 (35.1) (51.9)
Changes in working capital items:
Receivables (40.1) 32.2 (77.9)
Inventories at FIFO cost (117.8) (70.2) (91.4)
Prepaid expenses and other current assets 51.8 (21.7) (39.1)
Payables and accruals (199.8) (16.4) 309.9
Net cash flow from operating activities 1,938.1 2,150.0 1,909.5
INVESTING ACTIVITIES:
Cash paid for property additions (1,370.5) (1,672.3) (1,435.7)
Proceeds from sale of property 89.3 112.7 158.1
Net cash used to acquire Genuardi’s –(523.1) –
Other (31.9) (48.9) (59.4)
Net cash flow used by investing activities (1,313.1) (2,131.6) (1,337.0)