Safeway 2002 Annual Report Download - page 19
Download and view the complete annual report
Please find page 19 of the 2002 Safeway annual report below. You can navigate through the pages in the report by either clicking on the pages listed below, or by using the keyword search tool below to find specific information within the annual report.-
 1
1 -
2
-
3
-
4
-
5
-
6
-
7
-
8
-
 9
9 -
 10
10 -
 11
11 -
 12
12 -
 13
13 -
 14
14 -
 15
15 -
 16
16 -
 17
17 -
 18
18 -
 19
19 -
 20
20 -
 21
21 -
 22
22 -
 23
23 -
 24
24 -
 25
25 -
 26
26 -
 27
27 -
 28
28 -
 29
29 -
30
-
31
-
32
-
33
-
34
-
35
-
36
-
37
-
38
-
39
-
40
-
41
-
42
-
43
-
44
-
45
-
46
-
47
-
48
-
49
-
50
-
51
-
52
-
53
-
54
-
55
-
56
 |
 |

SAFEWAY INC. 2002 ANNUAL REPORT 17
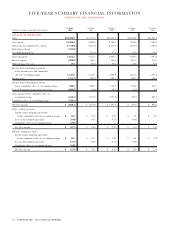
FIVE-YEAR SUMMARY FINANCIAL INFORMATION
SAFEWAY INC. AND SUBSIDIARIES
52 Weeks 52 Weeks 52 Weeks 52 Weeks 53 Weeks
(Dollars in millions, except per-share amounts) 2002 2001 2000 1999 1998
FINANCIAL STATISTICS
Comparable-store sales (decreases) increases (Note 1) (0.6)% 2.7% 3.1% 2.6% 4.1%
Identical-store sales (decreases) increases (Note 1) (1.2)% 2.0% 2.5% 2.0% 3.7%
Gross profit margin 31.16% 30.98% 29.85% 29.69% 29.17%
Operating and administrative expense
as a percent of sales (Note 2) 23.82% 22.68% 21.87% 22.25% 22.34%
Operating profit as a percent of sales 5.2% 8.0% 7.7% 7.2% 6.6%
Cash capital expenditures $ 1,370.5 $ 1,672.3 $ 1,435.7 $ 1,193.7 $ 1,022.9
Depreciation 812.5 726.6 640.4 535.9 466.7
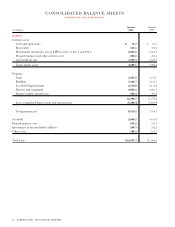
Total assets 16,047.3 17,462.6 15,965.3 14,900.3 11,389.6
Total debt 8,327.0 7,271.5 6,352.3 6,777.6 4,768.4
Total stockholders’ equity 3,627.5 5,889.6 5,389.8 4,085.8 3,082.1
Weighted average shares outstanding — basic
(in millions) 467.3 503.3 497.9 498.6 482.8
Weighted average shares outstanding — diluted
(in millions) 473.8 513.2 511.6 515.4 508.8
OTHER STATISTICS
Genuardi’s stores acquired during the year –39–––
Randall’s stores acquired during the year –– – 117 –
Carrs stores acquired during the year –– – 32 –
Stores opened during the year 71 91 70 58 45
Stores closed or sold during the year 32 44 45 45 30
Total stores at year-end 1,695 1,656 1,570 1,545 1,383
Remodels completed during the year (Note 3) 191 231 236 240 234
Total retail square footage at year-end (in millions) 74.6 71.8 66.5 63.9 54.7
Note 1. Defined as stores operating the entire year in both the current year and the previous year. Comparable stores include replacement stores while identical stores do not. 2001 and 2000 sales increases
reflect actual results and have not been adjusted to eliminate the estimated 50-basis-point impact of the 2000 northern California distribution center strike.
Note 2. Excludes goodwill amortization. Management believes this ratio is relevant because it assists investors in evaluating Safeway’s ability to control costs.
Note 3. Defined as store remodel projects (other than maintenance) generally requiring expenditures in excess of $200,000.