Safeway 2002 Annual Report Download - page 49
Download and view the complete annual report
Please find page 49 of the 2002 Safeway annual report below. You can navigate through the pages in the report by either clicking on the pages listed below, or by using the keyword search tool below to find specific information within the annual report.-
 1
1 -
2
-
3
-
4
-
5
-
6
-
7
-
8
-
9
-
10
-
11
-
12
-
13
-
14
-
15
-
16
-
17
-
18
-
19
-
20
-
21
-
22
-
23
-
24
-
25
-
26
-
27
-
28
-
29
-
30
-
31
-
32
-
33
-
34
-
35
-
36
-
37
-
38
-
 39
39 -
 40
40 -
 41
41 -
 42
42 -
 43
43 -
 44
44 -
 45
45 -
 46
46 -
 47
47 -
 48
48 -
 49
49 -
 50
50 -
 51
51 -
 52
52 -
 53
53 -
 54
54 -
 55
55 -
 56
56
 |
 |
SAFEWAY INC. 2002 ANNUAL REPORT 47
In accordance with SFAS No. 144, Dominick’s net assets
and liabilities have been written down to estimated fair
value. The fair value of Dominick’s was determined by an
independent third party appraiser which primarily used the
discounted cash flow method and the guideline company
method. The final valuation of Dominick’s is dependent
upon the results of negotiations with the ultimate buyer.
Adjustment to the loss on disposition, together with any
related tax effects, will be made when additional information
is known.
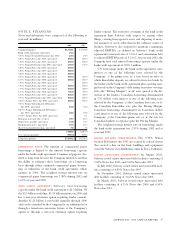
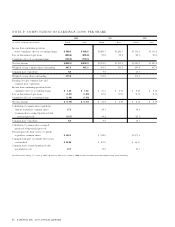
The following table presents Dominick’s major classes of
assets and liabilities as of year-end 2002 and 2001 (in millions):
2002 2001
Current assets $252.9 $254.3
Property, net 520.5 725.0
Other long-term assets 279.9 1,458.0
Current debt, including obligations
under capital leases 17.4 11.2
Other current liabilities 192.2 199.3
Long-term debt, including obligations
under capital leases 91.1 117.1
Other long-term liabilities 52.6 72.8
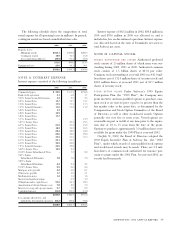
NOTE O: SEGMENTS
Safeway’s retail grocery business, which represents more than 98% of consolidated sales and operates in the United States and
Canada, is its only reportable segment.
The following table presents information about the Company by geographic area (in millions):
U.S. Canada Total
2002
Sales $28,922.4 $3,476.8 $32,399.2
Operating profit 1,498.7 174.6 1,673.3
Income from continuing operations before income taxes and
cumulative effect of accounting change 1,151.2 169.0 1,320.2
Long-lived assets 7,356.2 654.0 8,010.2
Total assets 14,948.9 1,098.4 16,047.3
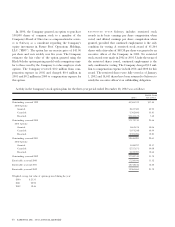
2001
Sales $ 28,362.2 $ 3,434.8 $ 31,797.0
Operating profit 2,330.0 205.7 2,535.7
Income from continuing operations before income taxes 1,927.5 195.2 2,122.7
Long-lived assets 6,774.0 642.7 7,416.7
Total assets 16,417.5 1,045.1 17,462.6
2000
Sales $ 25,998.5 $ 3,443.0 $ 29,441.5
Operating profit 2,064.3 200.2 2,264.5
Income from continuing operations before income taxes 1,752.0 190.9 1,942.9
Long-lived assets 5,833.8 614.5 6,448.3
Total assets 14,931.5 1,033.8 15,965.3