Safeway 2002 Annual Report Download - page 2
Download and view the complete annual report
Please find page 2 of the 2002 Safeway annual report below. You can navigate through the pages in the report by either clicking on the pages listed below, or by using the keyword search tool below to find specific information within the annual report.-
 1
1 -
 2
2 -
 3
3 -
 4
4 -
 5
5 -
 6
6 -
 7
7 -
 8
8 -
 9
9 -
 10
10 -
 11
11 -
 12
12 -
 13
13 -
14
-
15
-
16
-
17
-
18
-
19
-
20
-
21
-
22
-
23
-
24
-
25
-
26
-
27
-
28
-
29
-
30
-
31
-
32
-
33
-
34
-
35
-
36
-
37
-
38
-
39
-
40
-
41
-
42
-
43
-
44
-
45
-
46
-
47
-
48
-
49
-
50
-
51
-
52
-
53
-
54
-
55
-
56
 |
 |

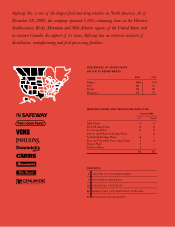
PERCENTAGE OF STORES WITH
SPECIALTY DEPARTMENTS
2002 1998
Bakery 93% 85%
Deli 96 93
Floral 91 88
Pharmacy 70 58
MANUFACTURING AND PROCESSING FACILITIES
U.S. Canada
Milk Plants 73
Bread Baking Plants 62
Ice Cream Plants 22
Cheese and Meat Packaging Plants –2
Soft Drink Bottling Plants 4–
Fruit and Vegetable Processing Plants 13
Biscuit Plant 1–
Pet Food Plant 1–
22 12
CONTENTS
2 LETTER TO STOCKHOLDERS
4EDITORIAL MATERIAL
12 FINANCIAL CONTENTS
52 DIRECTORS AND PRINCIPAL OFFICERS
53 INVESTOR INFORMATION
Safeway Inc. is one of the largest food and drug retailers in North America. As of
December 28, 2002, the company operated 1,695 continuing stores in the Western,
Southwestern, Rocky Mountain and Mid-Atlantic regions of the United States and
in western Canada. In support of its stores, Safeway has an extensive network of
distribution, manufacturing and food processing facilities.
Year-end 2002