Safeway 2002 Annual Report Download - page 16
Download and view the complete annual report
Please find page 16 of the 2002 Safeway annual report below. You can navigate through the pages in the report by either clicking on the pages listed below, or by using the keyword search tool below to find specific information within the annual report.-
 1
1 -
2
-
3
-
4
-
5
-
 6
6 -
 7
7 -
 8
8 -
 9
9 -
 10
10 -
 11
11 -
 12
12 -
 13
13 -
 14
14 -
 15
15 -
 16
16 -
 17
17 -
 18
18 -
 19
19 -
 20
20 -
 21
21 -
 22
22 -
 23
23 -
 24
24 -
 25
25 -
 26
26 -
27
-
28
-
29
-
30
-
31
-
32
-
33
-
34
-
35
-
36
-
37
-
38
-
39
-
40
-
41
-
42
-
43
-
44
-
45
-
46
-
47
-
48
-
49
-
50
-
51
-
52
-
53
-
54
-
55
-
56
 |
 |

14 SAFEWAY INC. 2002 ANNUAL REPORT
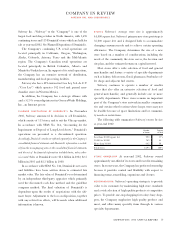
Safeway has developed a line of some 1,265 premium
corporate brand products since 1993 under the “Safeway
SELECT” banner. The award-winning Safeway SELECT
line is designed to offer premium quality products that the
Company believes are equal or superior in quality to com-
parable best-selling nationally advertised brands, or are
unique to the category and not available from national
brand manufacturers.
The Safeway SELECT line of products includes carbon-
ated soft drinks; unique salsas; bagged salads; whole bean
coffees; the Indulgence line of cookies and other sweets; the
Verdi line of frozen pizzas, fresh and frozen pastas, pasta
sauces and olive oils; the Primo Taglio line of meats, cheeses
and sandwiches; Artisan fresh-baked breads; NutraBalance
pet food; Ultra laundry detergents and dish soaps; and Softly
paper products. The Safeway SELECT line also includes an
extensive array of ice creams, frozen yogurts and sorbets;
Healthy Advantage items such as low-fat ice creams and
low-fat cereal bars; and Gourmet Club frozen entrees and
hors d’oeuvres.
MANUFACTURING AND WHOLESALE The principal function
of manufacturing operations is to purchase, manufacture
and process private label merchandise sold in stores operat-
ed by the Company. As measured by sales dollars, approxi-
mately 28% of Safeway’s private label merchandise is
manufactured in Company-owned plants, and the remain-
der is purchased from third parties.
Safeway’s Canadian subsidiary has a wholesale opera-
tion that distributes both national brands and private
label products to independent grocery stores and institu-
tional customers.
Safeway operated the following manufacturing and pro-
cessing facilities at year-end 2002:
U.S. Canada
Milk plants 7 3
Bread baking plants 6 2
Ice cream plants 2 2
Cheese and meat packaging plants – 2
Soft drink bottling plants 4 –
Fruit and vegetable processing plants 1 3
Biscuit plant 1 –
Pet food plant 1 –
Total 22 12
In addition, the Company operates laboratory facilities
for quality assurance and research and development in cer-
tain of its plants and at its corporate offices.
DISTRIBUTION Each of Safeway’s 11 retail operating areas is
served by a regional distribution center consisting of one or
more facilities. Safeway has 15 distribution/warehousing cen-
ters (12 in the United States and three in Canada), which col-
lectively provide the majority of all products to Safeway stores.
The Company’s distribution centers in northern California,
Maryland and British Columbia are operated by third parties.
CAPITAL EXPENDITURE PROGRAM
A component of the Company’s long-term strategy is its
capital expenditure program. The Company’s capital
expenditure program funds, among other things, new stores,
remodels, manufacturing plants, distribution facilities and
information technology advances. Over the last several
years, Safeway management has continued to strengthen its
program to select and approve new capital investments.
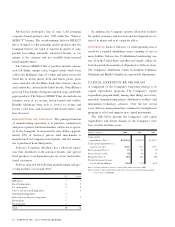
The table below presents the Company’s cash capital
expenditures and details changes in the Company’s store
base over the last three years:
(Dollars in millions) 2002 2001 2000
Cash capital
expenditures (Note 1) $1,370.5 $1,672.3 $1,435.7
Cash capital expenditures as
a percent of sales 4.2% 5.3% 4.9%
Stores opened (Note 1) 71 91 70
Stores closed or sold 32 44 45
Remodels (Note 2) 191 231 236
Total retail square footage
at year-end (in millions) 74.6 71.8 66.5
Note 1. Excludes acquisitions. Includes 11 former ABCO stores purchased in 2001.
Note 2. Defined as store remodel projects (other than maintenance) generally requiring expendi-
tures in excess of $200,000.