Safeway 2002 Annual Report Download - page 45
Download and view the complete annual report
Please find page 45 of the 2002 Safeway annual report below. You can navigate through the pages in the report by either clicking on the pages listed below, or by using the keyword search tool below to find specific information within the annual report.-
 1
1 -
2
-
3
-
4
-
5
-
6
-
7
-
8
-
9
-
10
-
11
-
12
-
13
-
14
-
15
-
16
-
17
-
18
-
19
-
20
-
21
-
22
-
23
-
24
-
25
-
26
-
27
-
28
-
29
-
30
-
31
-
32
-
33
-
34
-
 35
35 -
 36
36 -
 37
37 -
 38
38 -
 39
39 -
 40
40 -
 41
41 -
 42
42 -
 43
43 -
 44
44 -
 45
45 -
 46
46 -
 47
47 -
 48
48 -
 49
49 -
 50
50 -
 51
51 -
 52
52 -
 53
53 -
 54
54 -
 55
55 -
56
 |
 |

SAFEWAY INC. 2002 ANNUAL REPORT 43
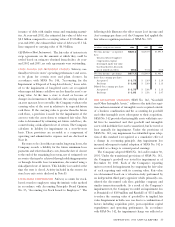
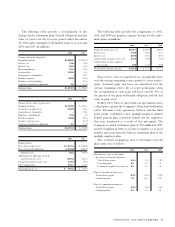
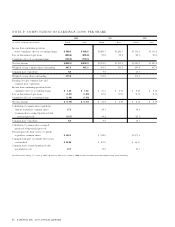
The following tables provide a reconciliation of the
changes in the retirement plans’ benefit obligation and fair
value of assets over the two-year period ended December
28, 2002 and a statement of the funded status as of year-end
2002 and 2001 (in millions):
2002 2001
Change in benefit obligation:
Beginning balance $1,286.9 $1,181.9
Service cost 74.6 58.2
Interest cost 82.9 76.4
Plan amendments 19.4 19.0
Actuarial loss 138.9 51.3
Acquisition of Genuardi’s –22.7
Benefit payments (86.0) (85.3)
Transfer of plan liabilities –(21.5)
Currency translation adjustment 2.5 (15.8)
Ending balance $1,519.2 $1,286.9
2002 2001
Change in fair value of plan assets:
Beginning balance $1,782.8 $1,956.7
Actual loss on plan assets (158.5) (56.1)
Acquisition of Genuardi’s –24.4
Employer contributions 31.8 5.9
Benefit payments (86.0) (85.3)
Transfer of plan assets –(46.9)
Currency translation adjustment 2.3 (15.9)
Ending balance $1,572.4 $1,782.8
2002 2001
Funded status:
Fair value of plan assets $ 1,572.4 $ 1,782.8
Projected benefit obligation (1,519.2) (1,286.9)
Funded status 53.2 495.9
Adjustment for difference in book
and tax basis of assets (165.1) (165.1)
Unamortized prior service cost 104.0 99.0
Unrecognized loss 543.1 101.5
Prepaid pension cost $ 535.2 $ 531.3
The following table provides the components of 2002,
2001 and 2000 net pension (expense) income for the retire-
ment plans (in millions):
2002 2001 2000
Estimated return on assets $143.7 $158.9 $182.3
Service cost (74.6) (58.2) (47.7)
Interest cost (82.9) (76.4) (84.7)
Amortization of prior service cost (14.7) (14.0) (14.8)
Amortization of unrecognized
(losses) gains (1.8) 17.0 42.2
Net pension (expense) income $ (30.3) $ 27.3 $ 77.3
Prior service costs are amortized on a straight-line basis
over the average remaining service period of active partici-
pants. Actuarial gains and losses are amortized over the
average remaining service life of active participants when
the accumulation of such gains and losses exceeds 10% of
the greater of the projected benefit obligation and the fair
value of plan assets.
In May 2000, Safeway entered into an agreement to have
a third party operate the Company’s Maryland distribution
center. Pursuant to the agreement, Safeway and the third
party jointly established a new multiple-employer defined
benefit pension plan to provide benefits for the employees
that were transferred as a result of this agreement. The
Company recorded settlement gains of $9.3 million in 2001
and $15.0 million in 2000 as a result of transfers of accrued
benefits and assets from the Safeway retirement plan to the
multiple employer plan.
The actuarial assumptions used to determine year-end
plan status were as follows:
2002 2001 2000
Discount rate used to determine
the projected benefit obligation:
United States plans 6.5% 7.5% 7.8%
Canadian plans 6.5 7.0 7.0
Combined weighted average rate 6.5 7.4 7.6
Expected return on plan assets:
United States plans 8.5% 9.0% 9.0%
Canadian plans 7.5 8.0 8.0
Rate of compensation increase:
United States plans 5.0% 5.0% 5.0%
Canadian plans 3.5 5.0 5.0