Safeway 2004 Annual Report Download - page 19
Download and view the complete annual report
Please find page 19 of the 2004 Safeway annual report below. You can navigate through the pages in the report by either clicking on the pages listed below, or by using the keyword search tool below to find specific information within the annual report.-
 1
1 -
2
-
3
-
4
-
5
-
6
-
7
-
8
-
 9
9 -
 10
10 -
 11
11 -
 12
12 -
 13
13 -
 14
14 -
 15
15 -
 16
16 -
 17
17 -
 18
18 -
 19
19 -
 20
20 -
 21
21 -
 22
22 -
 23
23 -
 24
24 -
 25
25 -
 26
26 -
 27
27 -
 28
28 -
 29
29 -
30
-
31
-
32
-
33
-
34
-
35
-
36
-
37
-
38
-
39
-
40
-
41
-
42
-
43
-
44
-
45
-
46
-
47
-
48
-
49
-
50
-
51
-
52
-
53
-
54
-
55
-
56
-
57
-
58
-
59
-
60
 |
 |

SAFEWAY INC. 2004 ANNUAL REPORT 17
SAFEWAY INC. AND SUBSIDIARIES
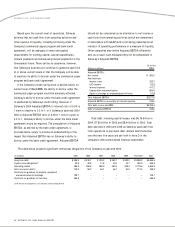
The table below presents principal amounts and related weighted average rates by year of maturity for the Company’s debt
obligations at year-end 2004 (dollars in millions):
2005 2006 2007 2008 2009 Thereafter Total Fair Value
Commercial paper:
Principal – $ 105.0 – – – – $ 105.0 $ 105.0
Weighted average interest rate – 2.28% – – – – 2.28%
Long-term debt:(1)
Principal $ 596.9 $ 713.7 $ 785.2 $ 553.7 $ 502.2 $2,809.9 $5,961.6 $6,313.5
Weighted average interest rate 3.10% 6.13% 5.79% 5.21% 7.50% 6.16% 5.83%
(1) Primarily fixed-rate debt
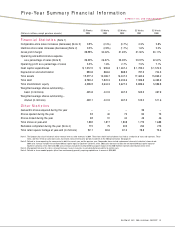
The table below presents the Company’s cash capital
expenditures and details changes in the Company’s store
base over the last three years:
(Dollars in millions) 2004 2003 2002
Cash capital expenditures $1,212.5 $935.8 $1,467.4
Cash capital expenditures
as a percentage of sales
and other revenue 3.4% 2.6% 4.2%
Stores opened 33 40 75
Stores closed 48 31 40
Remodels (Note 1) 115 75 203
Total retail square footage
at year end (in millions) 82.1 82.6 81.5
Number of fuel stations
at year end 311 270 214
Note 1: Defined as store remodel projects (other than maintenance) generally requiring
expenditures in excess of $200,000.
During 2004, Safeway invested $1.2 billion in cash
capital expenditures. The Company opened 33 new Lifestyle
stores, remodeled 115 existing stores – 94 of them were
refurbished to Lifestyle standards – and closed 48 stores. In
2005, the Company expects to spend approximately $1.4
billion in cash capital expenditures and open approximately
30 to 35 new Lifestyle stores while completing some 275 to
285 Lifestyle remodels. By the end of 2005, Safeway plans
to operate approximately 450 Lifestyle stores, more than
three times the current total.
MARKET RISK FROM FINANCIAL INSTRUMENTS
Safeway manages interest rate risk through the strategic
use of fixed and variable interest rate debt and, from time
to time, interest rate swaps. As of year-end 2004, the
Company effectively converted $500 million of its 4.95%
fixed-rate debt and $300 million of its 4.125% fixed-rate
debt to floating rate debt through interest rate swap
agreements.
The Company does not utilize financial instruments
for trading or other speculative purposes, nor does it
utilize leveraged financial instruments. The Company
does not consider the potential declines in future earnings,
fair values and cash flows from reasonably possible
near-term changes in interest rates and exchange rates to
be material.