Safeway 2004 Annual Report Download - page 44
Download and view the complete annual report
Please find page 44 of the 2004 Safeway annual report below. You can navigate through the pages in the report by either clicking on the pages listed below, or by using the keyword search tool below to find specific information within the annual report.-
 1
1 -
2
-
3
-
4
-
5
-
6
-
7
-
8
-
9
-
10
-
11
-
12
-
13
-
14
-
15
-
16
-
17
-
18
-
19
-
20
-
21
-
22
-
23
-
24
-
25
-
26
-
27
-
28
-
29
-
30
-
31
-
32
-
33
-
 34
34 -
 35
35 -
 36
36 -
 37
37 -
 38
38 -
 39
39 -
 40
40 -
 41
41 -
 42
42 -
 43
43 -
 44
44 -
 45
45 -
 46
46 -
 47
47 -
 48
48 -
 49
49 -
 50
50 -
 51
51 -
 52
52 -
 53
53 -
 54
54 -
55
-
56
-
57
-
58
-
59
-
60
 |
 |

SAFEWAY INC. AND SUBSIDIARIES
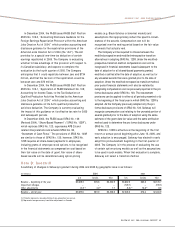
MORTGAGE NOTES PAYABLE Mortgage notes payable at
year-end 2004 have remaining terms ranging from one to
19 years, have a weighted average interest rate of 8.28%
and are secured by properties with a net book value of
approximately $160.2 million.
SENIOR SECURED INDEBTEDNESS The 9.30% Senior
Secured Debentures due 2007 are secured by a deed of trust
that created a lien on the land, buildings and equipment owned
by Safeway at its distribution center in Tracy, California.
SENIOR UNSECURED INDEBTEDNESS In August 2004,
Safeway issued senior unsecured debt securities consisting
of $500.0 million of 4.95% Notes due 2010 and $250.0
million of 5.625% Notes due 2014.
In October 2003, Safeway issued senior unsecured debt
facilities consisting of $150.0 million of Floating Rate Notes
(LIBOR plus 0.47%) due 2005, $200.0 million of 2.50% Notes
due 2005 and $300.0 million of 4.125% Notes due 2008.
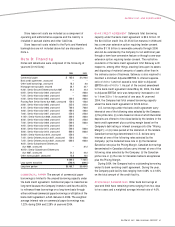
SENIOR SUBORDINATED INDEBTEDNESS The 9.875%
Senior Subordinated Debentures due 2007 are subordinated
in right of payment to, among other things, the Company’s
borrowings under the bank credit agreement, the 9.30%
Senior Secured Debentures, the Senior Unsecured
Indebtedness and mortgage notes payable.
OTHER NOTES PAYABLE Other notes payable at year-end
2004 have remaining terms ranging from one to 18 years
and a weighted average interest rate of 1.58%.
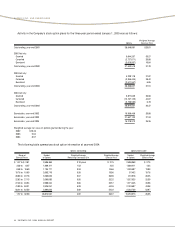
ANNUAL DEBT MATURITIES As of year-end 2004, annual
debt maturities were as follows (in millions):
2005 $ 596.9
2006 818.7
2007 785.2
2008 553.7
2009 502.2
Thereafter 2,809.9
$6,066.6
LETTERS OF CREDIT The Company had letters of credit of
$79.0 million outstanding at year-end 2004, of which $41.8
million were issued under the bank credit agreement. The
letters of credit are maintained primarily to support
performance, payment, deposit or surety obligations of the
Company. The Company pays commissions ranging from
0.15% to 1.00% on the face amount of the letters of credit.
Note E: Lease Obligations
Approximately two-thirds of the premises that the Company
occupies are leased. The Company had approximately 1,600
leases at year-end 2004, including approximately 230 that
are capitalized for financial reporting purposes. Most leases
have renewal options, some with terms and conditions
similar to the original lease, others with reduced rental
rates during the option periods. Certain of these leases
contain options to purchase the property at amounts that
approximate fair market value.
As of year-end 2004, future minimum rental payments
applicable to non-cancelable capital and operating leases
with remaining terms in excess of one year were as follows
(in millions): Capital Operating
Leases Leases
2005 $ 111.6 $ 405.9
2006 105.5 396.8
2007 102.4 380.9
2008 99.0 362.5
2009 96.0 328.3
Thereafter 902.1 2,778.6
Total minimum lease payments 1,416.6 $4,653.0
Less amounts representing interest (719.8)
Present value of net minimum lease payments 696.8
Less current obligations (42.8)
Long-term obligations $ 654.0
Future minimum lease payments under non-cancelable
capital and operating lease agreements have not been
reduced by minimum sublease rental income of $161.5 million.
Amortization expense for property under capital leases
was $43.4 million in 2004, $35.4 million in 2003 and $42.4
million in 2002. Accumulated amortization of property under
capital leases was $230.9 million at year-end 2004 and
$181.6 million at year-end 2003.
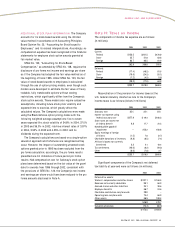
The following schedule shows the composition of total
rental expense for all operating leases (in millions). In general,
contingent rentals are based on individual store sales.
2004 2003 2002
Property leases:
Minimum rentals $406.9 $411.4 $388.7
Contingent rentals 20.7 25.6 17.0
Less rentals from subleases (28.1) (31.4) (31.3)
399.5 405.6 374.4
Equipment leases 24.1 25.2 25.6
$423.6 $430.8 $400.0
42 SAFEWAY INC. 2004 ANNUAL REPORT