Safeway 2004 Annual Report Download - page 34
Download and view the complete annual report
Please find page 34 of the 2004 Safeway annual report below. You can navigate through the pages in the report by either clicking on the pages listed below, or by using the keyword search tool below to find specific information within the annual report.-
 1
1 -
2
-
3
-
4
-
5
-
6
-
7
-
8
-
9
-
10
-
11
-
12
-
13
-
14
-
15
-
16
-
17
-
18
-
19
-
20
-
21
-
22
-
23
-
 24
24 -
 25
25 -
 26
26 -
 27
27 -
 28
28 -
 29
29 -
 30
30 -
 31
31 -
 32
32 -
 33
33 -
 34
34 -
 35
35 -
 36
36 -
 37
37 -
 38
38 -
 39
39 -
 40
40 -
 41
41 -
 42
42 -
 43
43 -
 44
44 -
45
-
46
-
47
-
48
-
49
-
50
-
51
-
52
-
53
-
54
-
55
-
56
-
57
-
58
-
59
-
60
 |
 |

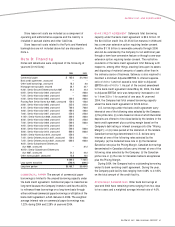
32 SAFEWAY INC. 2004 ANNUAL REPORT
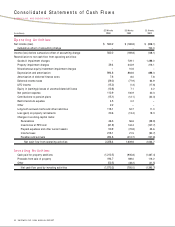
Consolidated Statements of Cash Flows
SAFEWAY INC. AND SUBSIDIARIES
52 Weeks 53 Weeks 52 Weeks
(In millions) 2004 2003 2002
Operating Activities:
Net income (loss) $ 560.2 $ (169.8) $ (828.1)
Cumulative effect of accounting change ––700.0
Income (loss) before cumulative effect of accounting change 560.2 (169.8) (128.1)
Reconciliation to net cash flow from operating activities:
Goodwill impairment charges –729.1 1,288.0
Property impairment charges 39.4 344.9 213.1
Miscellaneous equity investment impairment charges –10.6 –
Depreciation and amortization 894.6 863.6 888.3
Amortization of deferred finance costs 7.8 8.0 7.8
Deferred income taxes (29.2) (77.9) 64.9
LIFO income (15.2) (1.3) (17.6)
Equity in (earnings) losses of unconsolidated affiliates (12.6) 7.1 0.2
Net pension expense 112.9 130.9 30.3
Contributions to pension plans (15.1) (12.1) (32.0)
Restricted stock expense 4.5 0.2 –
Other 2.2 ––
Long-term accrued claims and other liabilities 118.1 52.7 11.0
Loss (gain) on property retirements 20.6 (13.4) 19.3
Changes in working capital items:
Receivables 46.3 56.6 (39.9)
Inventories at FIFO cost (61.9) 144.4 (107.7)
Prepaid expenses and other current assets 50.9 (72.8) 55.6
Income taxes 218.1 21.5 (90.7)
Payables and accruals 284.8 (412.7) (127.8)
Net cash flow from operating activities 2,226.4 1,609.6 2,034.7
Investing Activities:
Cash paid for property additions (1,212.5) (935.8) (1,467.4)
Proceeds from sale of property 194.7 189.0 113.2
Other (52.5) (48.2) (41.5)
Net cash flow used by investing activities (1,070.3) (795.0) (1,395.7)