Safeway 2004 Annual Report Download - page 36
Download and view the complete annual report
Please find page 36 of the 2004 Safeway annual report below. You can navigate through the pages in the report by either clicking on the pages listed below, or by using the keyword search tool below to find specific information within the annual report.-
 1
1 -
2
-
3
-
4
-
5
-
6
-
7
-
8
-
9
-
10
-
11
-
12
-
13
-
14
-
15
-
16
-
17
-
18
-
19
-
20
-
21
-
22
-
23
-
24
-
25
-
 26
26 -
 27
27 -
 28
28 -
 29
29 -
 30
30 -
 31
31 -
 32
32 -
 33
33 -
 34
34 -
 35
35 -
 36
36 -
 37
37 -
 38
38 -
 39
39 -
 40
40 -
 41
41 -
 42
42 -
 43
43 -
 44
44 -
 45
45 -
 46
46 -
47
-
48
-
49
-
50
-
51
-
52
-
53
-
54
-
55
-
56
-
57
-
58
-
59
-
60
 |
 |

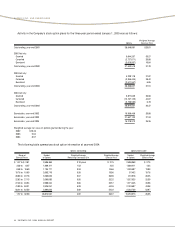
34 SAFEWAY INC. 2004 ANNUAL REPORT
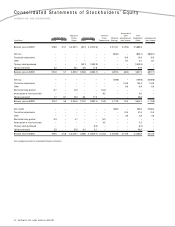
Consolidated Statements of Stockholders’ Equity
SAFEWAY INC. AND SUBSIDIARIES
Accumulated
Additional Deferred Other Total
Common Stock Paid-in Treasury Stock Stock Retained Comprehensive Stockholders’Comprehensive
(In millions) Shares Amount Capital Shares Cost Compensation Earnings (Loss) Income Equity (Loss) Income
Balance, year-end 2001 570.8 $ 5.7 $ 3,267.1 (82.7) $ (2,419.6) –$ 5,115.7 $ (79.3) $ 5,889.6
Net loss –– –– ––(828.1) –(828.1) $(828.1)
Translation adjustments –– –– –– –10.3 10.3 10.3
Other –– –– –– –0.7 0.7 0.7
Treasury stock purchased –– –(50.1) (1,502.9) –––(1,502.9) –
Options exercised 2.2 –40.1 0.8 17.8 –––57.9 –
Balance, year-end 2002 573.0 5.7 3,307.2 (132.0) (3,904.7) –4,287.6 (68.3) 3,627.5 $(817.1)
Net loss –– –– ––(169.8) –(169.8) $(169.8)
Translation adjustments –– –– –– –154.9 154.9 154.9
Other –– –– –– –0.9 0.9 0.9
Restricted stock granted 0.7 –14.2 ––(14.2) –– – –
Amortization of restricted stock –– –– –0.2 –– 0.2 –
Options exercised 1.7 0.1 13.2 0.8 17.3 –––30.6 –
Balance, year-end 2003 575.4 5.8 3,334.6 (131.2) (3,887.4) (14.0) 4,117.8 87.5 3,644.3 $ (14.0)
Net income –– –– ––560.2 –560.2 $ 560.2
Translation adjustments –– –– –– –51.5 51.5 51.5
Other –– –– –– –5.9 5.9 5.9
Restricted stock granted 0.3 –5.7 ––(5.7) –– – –
Amortization of restricted stock –– –– –4.5 –– 4.5 –
Treasury stock purchased –– ––(0.4) –––(0.4) –
Options exercised 2.8 –32.8 0.4 8.1 –––40.9 –
Balance, year-end 2004 578.5 $ 5.8 $ 3,373.1 (130.8) $ (3,879.7) $ (15.2) $ 4,678.0 $ 144.9 $ 4,306.9 $ 617.6
See accompanying notes to consolidated financial statements.