Safeway 2004 Annual Report Download - page 4
Download and view the complete annual report
Please find page 4 of the 2004 Safeway annual report below. You can navigate through the pages in the report by either clicking on the pages listed below, or by using the keyword search tool below to find specific information within the annual report.-
 1
1 -
 2
2 -
 3
3 -
 4
4 -
 5
5 -
 6
6 -
 7
7 -
 8
8 -
 9
9 -
 10
10 -
 11
11 -
 12
12 -
 13
13 -
 14
14 -
 15
15 -
16
-
17
-
18
-
19
-
20
-
21
-
22
-
23
-
24
-
25
-
26
-
27
-
28
-
29
-
30
-
31
-
32
-
33
-
34
-
35
-
36
-
37
-
38
-
39
-
40
-
41
-
42
-
43
-
44
-
45
-
46
-
47
-
48
-
49
-
50
-
51
-
52
-
53
-
54
-
55
-
56
-
57
-
58
-
59
-
60
 |
 |

2 SAFEWAY INC. 2004 ANNUAL REPORT
To Our Stockholders
While 2004 was another difficult year for our industry, we made solid progress on several fronts
and laid a strong foundation to support future growth. Among our most notable achievements,
we generated exceptionally strong cash flow from operations, which allowed us to significantly
reduce total debt; we dramatically improved the quality, selection and presentation of our
perishable offerings; and we began the rollout of our highly successful Lifestyle stores through
an aggressive remodeling program. We also made substantial progress restructuring labor
contracts, which we believe will enable us to compete more effectively going forward.
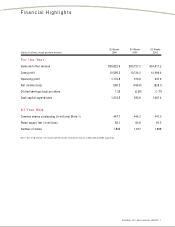
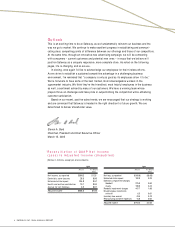
Results From Operations
Net income was $560.2 million ($1.25 per diluted share) in 2004 compared to a loss of $169.8
million ($0.38 per diluted share) in 2003.
As indicated in the table at the bottom of page 4, results for 2004 include total estimated
charges of approximately $308.1 million, after tax ($0.68 per diluted share), related to the
following items:
• Estimated impact of the Southern California strike;
• Dominick’s store closures;
• Contributions to a UFCW multi-employer health and welfare plan in Northern California; and
• A lease expense adjustment in accordance with recent SEC guidance on “rent holidays.”
Excluding these items, 2004 earnings would have been $1.93 per diluted share.1
For 2003, the same table outlines a total of almost $1.1 billion in after-tax charges
($2.43 per diluted share), related to the following items:
• Estimated impact of the Southern California strike;
• Dominick’s impairment charges;
• Randall’s impairment charges;
• Miscellaneous investments write-off;
• Inventory accounting change; and
• Restructuring and other expenses.
Excluding these items, net income in 2003 would have been $2.05 per diluted share.1
Sales
Total sales rose only slightly to $35.8 billion in 2004 from $35.7 billion in 2003, primarily
because of the strike and the extra week of operation in fiscal 2003, which was a 53-week year.
Excluding strike-affected stores, comparable-store sales increased 1.5%, while identical-store
sales (which do not include replacement stores) rose 0.9%. Further excluding fuel, comparable-
store sales declined 0.2%, while identical-store sales were down 0.8%.
With the lingering effects of the strike gradually abating, total sales have improved in the
first quarter of 2005. We are encouraged by this positive trend and expect it to continue as the
year progresses.
Gross Profit
Gross profit in 2004 declined 44 basis points to 29.58% of sales. The reduction was due primarily
to increased fuel sales (which have a lower gross margin) and the estimated impact of the strike.
Operating and Administrative Expense
Operating and administrative expense last year decreased 7 basis points to 26.30% of sales.
The slight improvement was due to lower impairment charges and higher fuel sales, partly
offset by the impact of the strike and higher wages, benefits and occupancy expenses.