Safeway 2004 Annual Report Download - page 28
Download and view the complete annual report
Please find page 28 of the 2004 Safeway annual report below. You can navigate through the pages in the report by either clicking on the pages listed below, or by using the keyword search tool below to find specific information within the annual report.-
 1
1 -
2
-
3
-
4
-
5
-
6
-
7
-
8
-
9
-
10
-
11
-
12
-
13
-
14
-
15
-
16
-
17
-
 18
18 -
 19
19 -
 20
20 -
 21
21 -
 22
22 -
 23
23 -
 24
24 -
 25
25 -
 26
26 -
 27
27 -
 28
28 -
 29
29 -
 30
30 -
 31
31 -
 32
32 -
 33
33 -
 34
34 -
 35
35 -
 36
36 -
 37
37 -
 38
38 -
39
-
40
-
41
-
42
-
43
-
44
-
45
-
46
-
47
-
48
-
49
-
50
-
51
-
52
-
53
-
54
-
55
-
56
-
57
-
58
-
59
-
60
 |
 |

SAFEWAY INC. AND SUBSIDIARIES
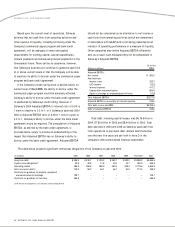
should not be considered as an alternative to net income or
cash flows from operating activities (which are determined
in accordance with GAAP) and is not being presented as an
indicator of operating performance or a measure of liquidity.
Other companies may define Adjusted EBITDA differently
and, as a result, such measures may not be comparable to
Safeway’s Adjusted EBITDA.
52 weeks
(Dollars in millions) 2004
Adjusted EBITDA:
Net income $ 560.2
Add (subtract):
Income taxes 233.7
LIFO income (15.2)
Interest expense 411.2
Depreciation and amortization 894.6
Equity in earnings of unconsolidated affiliates (12.6)
Total Adjusted EBITDA $2,071.9
Adjusted EBITDA as a multiple of interest expense 5.04x
Total debt at year-end 2004 $6,763.4
Debt to Adjusted EBITDA 3.26x
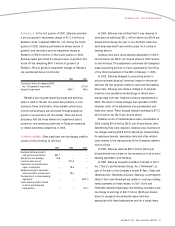
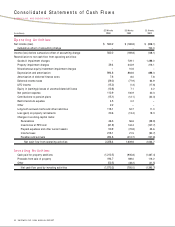
Total debt, including capital leases, was $6.76 billion in
2004, $7.82 billion in 2003 and $8.44 billion in 2002. Total
debt declined in 2004 and 2003 as Safeway used cash flow
from operations to pay down debt. Annual debt maturities
over the next five years are set forth in Note D of the
Company’s 2004 consolidated financial statements.
Based upon the current level of operations, Safeway
believes that net cash flow from operating activities and
other sources of liquidity, including borrowing under the
Company’s commercial paper program and bank credit
agreement, will be adequate to meet anticipated
requirements for working capital, capital expenditures,
interest payments and scheduled principal payments for the
foreseeable future. There can be no assurance, however,
that Safeway’s business will continue to generate cash flow
at or above current levels or that the Company will be able
to maintain its ability to borrow under the commercial paper
program and bank credit agreement.
If the Company’s credit rating were to decline below its
current level of Baa2/BBB, the ability to borrow under the
commercial paper program would be adversely affected.
Safeway’s ability to borrow under the bank credit agreement
is unaffected by Safeway’s credit rating. However, if
Safeway’s 2004 Adjusted EBITDA to interest ratio of 5.04 to
1 were to decline to 2.0 to 1, or if Safeway’s year-end 2004
debt to Adjusted EBITDA ratio of 3.26 to 1 were to grow to
4.0 to 1, Safeway’s ability to borrow under the bank credit
agreement would be impaired. The computation of Adjusted
EBITDA, as defined by the bank credit agreement, is
provided below solely to provide an understanding of the
impact that Adjusted EBITDA has on Safeway’s ability to
borrow under the bank credit agreement. Adjusted EBITDA
26 SAFEWAY INC. 2004 ANNUAL REPORT
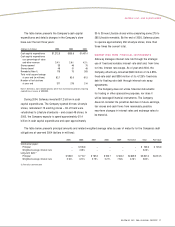
The table below presents significant contractual obligations of the Company at year-end 2004:
(In millions) 2005 2006 2007 2008 2009 Thereafter Total
Long-term debt $ 596.9 $ 818.7 $ 785.2 $ 553.7 $ 502.2 $2,809.9 $6,066.6
Capital lease obligations(1) 42.8 40.8 41.8 42.5 43.7 485.2 696.8
Operating leases 405.9 396.8 380.9 362.5 328.3 2,778.6 4,653.0
Self-insurance liability 142.9 96.2 66.1 46.7 34.5 112.5 498.9
Contracts for purchase of property, equipment
and construction of buildings 139.7 –––––139.7
Contracts for purchase of inventory 486.9 –––––486.9
(1) Minimum lease payments, less amounts representing interest