Safeway 2004 Annual Report Download - page 21
Download and view the complete annual report
Please find page 21 of the 2004 Safeway annual report below. You can navigate through the pages in the report by either clicking on the pages listed below, or by using the keyword search tool below to find specific information within the annual report.-
 1
1 -
2
-
3
-
4
-
5
-
6
-
7
-
8
-
9
-
10
-
 11
11 -
 12
12 -
 13
13 -
 14
14 -
 15
15 -
 16
16 -
 17
17 -
 18
18 -
 19
19 -
 20
20 -
 21
21 -
 22
22 -
 23
23 -
 24
24 -
 25
25 -
 26
26 -
 27
27 -
 28
28 -
 29
29 -
 30
30 -
 31
31 -
32
-
33
-
34
-
35
-
36
-
37
-
38
-
39
-
40
-
41
-
42
-
43
-
44
-
45
-
46
-
47
-
48
-
49
-
50
-
51
-
52
-
53
-
54
-
55
-
56
-
57
-
58
-
59
-
60
 |
 |

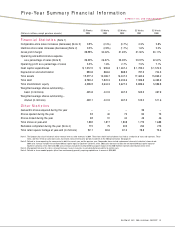
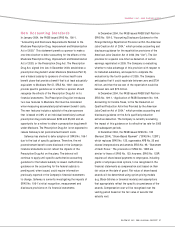
Five-Year Summary Financial Information
SAFEWAY INC. AND SUBSIDIARIES
SAFEWAY INC. 2004 ANNUAL REPORT 19
52 Weeks 53 Weeks 52 Weeks 52 Weeks 52 Weeks
(Dollars in millions, except per-share amounts) 2004 2003 2002 2001 2000
Financial Statistics (Note 1)
Comparable-store sales increases (decreases) (Note 2) 0.9% (2.4%) (0.7%) 2.3% 2.8%
Identical-store sales increases (decreases) (Note 2) 0.3% (2.8%) (1.7%) 1.6% 2.2%
Gross profit margin 29.58% 30.02% 31.49% 31.30% 30.11%
Operating and administrative expense
as a percentage of sales (Note 3) 26.30% 26.37% 25.09% 23.37% 22.61%
Operating profit as a percentage of sales 3.3% 1.6% 2.7% 7.5% 7.1%
Cash capital expenditures $ 1,212.5 $ 935.8 $ 1,467.4 $ 1,793.0 $ 1,572.5
Depreciation and amortization 894.6 863.6 888.3 797.3 704.5
Total assets 15,377.4 15,096.7 16,047.2 17,462.6 15,965.2
Total debt 6,763.4 7,822.3 8,435.6 7,399.8 6,495.9
Total stockholders’ equity 4,306.9 3,644.3 3,627.5 5,889.6 5,389.8
Weighted average shares outstanding –
basic (in millions) 445.6 441.9 467.3 503.3 497.9
Weighted average shares outstanding –
diluted (in millions) 449.1 441.9 467.3 513.2 511.6
Other Statistics
Genuardi’s stores acquired during the year –––39–
Stores opened during the year 33 40 75 95 75
Stores closed during the year 48 31 40 49 46
Total stores at year-end 1,802 1,817 1,808 1,773 1,688
Remodels completed during the year (Note 4) 115 75 203 255 275
Total retail square footage at year-end (in millions) 82.1 82.6 81.5 78.8 73.6
Note 1. The Company has classified certain minor revenue items as other revenues in 2004. These items had historically been classified as a reduction of costs and expenses. These
items, and their effect on same-store sales, have been reclassified for prior periods to conform to the 2004 presentation. See page 22.
Note 2. Defined as stores operating the same period in both the current year and the previous year. Comparable stores include replacement stores while identical stores do not.
2004 sales increase includes the estimated 60-basis-point impact of Southern California strike. 2003 sales decrease includes the estimated 240-basis-point impact of
Southern California strike. 2001 and 2000 sales increases include the estimated 50-basis-point impact of the 2000 Northern California distribution center strike.
Note 3. Management believes this ratio is relevant because it assists investors in evaluating Safeway’s ability to control costs.
Note 4. Defined as store remodel projects (other than maintenance) generally requiring expenditures in excess of $200,000.