Safeway 2004 Annual Report Download - page 3
Download and view the complete annual report
Please find page 3 of the 2004 Safeway annual report below. You can navigate through the pages in the report by either clicking on the pages listed below, or by using the keyword search tool below to find specific information within the annual report.-
 1
1 -
 2
2 -
 3
3 -
 4
4 -
 5
5 -
 6
6 -
 7
7 -
 8
8 -
 9
9 -
 10
10 -
 11
11 -
 12
12 -
 13
13 -
 14
14 -
15
-
16
-
17
-
18
-
19
-
20
-
21
-
22
-
23
-
24
-
25
-
26
-
27
-
28
-
29
-
30
-
31
-
32
-
33
-
34
-
35
-
36
-
37
-
38
-
39
-
40
-
41
-
42
-
43
-
44
-
45
-
46
-
47
-
48
-
49
-
50
-
51
-
52
-
53
-
54
-
55
-
56
-
57
-
58
-
59
-
60
 |
 |

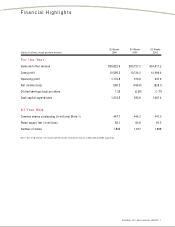
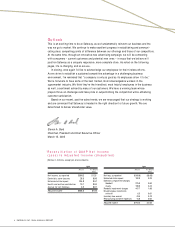
SAFEWAY INC. 2004 ANNUAL REPORT 1
52 Weeks 53 Weeks 52 Weeks
(Dollars in millions, except per-share amounts) 2004 2003 2002
For the Year:
Sales and other revenue $35,822.9 $35,727.2 $34,917.2
Gross profit 10,595.3 10,724.2 10,996.4
Operating profit 1,172.8 573.9 947.6
Net income (loss) 560.2 (169.8) (828.1)
Diluted earnings (loss) per share: 1.25 (0.38) (1.77)
Cash capital expenditures 1,212.5 935.8 1,467.4
At Year End:
Common shares outstanding (in millions) (Note 1) 447.7 444.2 441.0
Retail square feet (in millions) 82.1 82.6 81.5
Number of stores 1,802 1,817 1,808
Note 1: Net of 130.8 million, 131.2 million and 132.0 million shares held in treasury in 2004, 2003 and 2002, respectively.
Financial Highlights