Safeway 2004 Annual Report Download - page 54
Download and view the complete annual report
Please find page 54 of the 2004 Safeway annual report below. You can navigate through the pages in the report by either clicking on the pages listed below, or by using the keyword search tool below to find specific information within the annual report.-
 1
1 -
2
-
3
-
4
-
5
-
6
-
7
-
8
-
9
-
10
-
11
-
12
-
13
-
14
-
15
-
16
-
17
-
18
-
19
-
20
-
21
-
22
-
23
-
24
-
25
-
26
-
27
-
28
-
29
-
30
-
31
-
32
-
33
-
34
-
35
-
36
-
37
-
38
-
39
-
40
-
41
-
42
-
43
-
 44
44 -
 45
45 -
 46
46 -
 47
47 -
 48
48 -
 49
49 -
 50
50 -
 51
51 -
 52
52 -
 53
53 -
 54
54 -
 55
55 -
 56
56 -
 57
57 -
 58
58 -
 59
59 -
 60
60
 |
 |

52 SAFEWAY INC. 2004 ANNUAL REPORT
SAFEWAY INC. AND SUBSIDIARIES
Last 16 Third 12 Second 12 First 12
(In millions, except per-share amounts) 52 Weeks Weeks(2) Weeks(3) Weeks(4) Weeks(5)
2004
Sales, before reclassifications $35,621.9 $11,325.0 $8,297.0 $8,361.1 $7,638.8
Reclassifications(1) 201.0 65.4 46.2 45.4 43.9
Sales and other revenue, as adjusted 35,822.9 11,390.4 8,343.2 8,406.5 7,682.7
Gross profit, before reclassifications 10,391.9 3,295.0 2,416.6 2,403.7 2,276.6
Reclassifications(1) 203.4 61.7 49.4 48.0 44.4
Gross profit, as adjusted 10,595.3 3,356.7 2,466.0 2,451.7 2,321.0
Operating profit 1,172.8 406.2 294.5 317.0 155.2
Income before income taxes 793.9 303.9 201.7 226.2 62.1
Net income 560.2 202.7 159.2 155.2 43.1
Net income per share – basic $ 1.26 $ 0.45 $ 0.36 $ 0.35 $ 0.10
Net income per share – diluted 1.25 0.45 0.35 0.35 0.10
Price range, New York Stock Exchange $ 25.64 $ 21.17 $ 25.64 $ 24.67 $ 23.80
to 17.26 to 17.26 to 19.52 to 19.92 to 19.72
Last 17 Third 12 Second 12 First 12
(In millions, except per-share amounts) 53 Weeks Weeks(6) Weeks(7) Weeks(8) Weeks(9)
2003
Sales, before reclassifications $35,552.7 $10,984.7 $8,276.5 $8,248.1 $8,043.3
Reclassifications(1) 174.5 59.1 37.4 41.3 36.7
Sales and other revenue, as adjusted 35,727.2 11,043.8 8,313.9 8,289.4 8,080.0
Gross profit, before reclassifications 10,533.8 3,187.3 2,474.3 2,483.8 2,388.3
Reclassifications(1) 190.4 62.9 43.5 42.4 41.6
Gross profit, as adjusted 10,724.2 3,250.2 2,517.8 2,526.2 2,429.9
Operating profit (loss) 573.9 (321.7) 426.1 357.4 112.1
Income (loss) before income taxes 141.1 (458.0) 330.1 258.1 10.9
Net (loss) income (169.8) (695.9) 202.5 161.0 162.6
Net (loss) income per share – basic $ (0.38) $ (1.57) $ 0.46 $ 0.36 $ 0.37
Net (loss) income per share – diluted (0.38) (1.57) 0.45 0.36 0.36
Price range, New York Stock Exchange $ 25.80 $ 25.76 $ 25.66 $20.50 $25.80
to 16.45 to 19.87 to 19.79 to 16.45 to 17.59
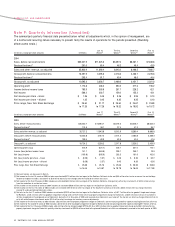
(1) Reclassifications are discussed in Note A.
(2) Net income for the last 16 weeks of 2004 includes an estimated $37.0 million after-tax impact of the Southern California strike and $6.5 million after-tax for an accrual for rent holidays.
Income tax expense includes a tax benefit of $8.8 million due to tax law changes and the resolution of certain tax issues.
(3) Net income for the third 12 weeks of 2004 includes an estimated $45.0 million after-tax impact of the Southern California strike partially offset by a tax benefit of $32.4 million arising
from the resolution of certain tax issues.
(4) Net income for the second 12 weeks of 2004 includes an estimated $50.0 million after-tax impact of the Southern California strike.
(5) Net income for the first 12 weeks of 2004 includes an estimated $122.0 million after-tax impact of the Southern California strike and a $28.5 million after-tax charge related to
closing 12 under-performing Dominick’s stores.
(6) Net loss for the last 17 weeks of 2003 includes an estimated $102.9 million after-tax impact of the Southern California strike, a $447.7 million after-tax goodwill impairment charge
for Randall’s, a $24.4 million after-tax goodwill impairment charge and a $116.9 million after-tax property impairment charge for Dominick’s, a $249.6 million reversal of tax benefits
initially recognized on the proposed sale of Dominick’s during the first 36 weeks of 2003 and reversed when Dominick’s was taken off the market, an after-tax charge of $6.5 million to
write off miscellaneous investments and a $43.5 million after-tax charge for inventory reserve adjustments.
(7) Net income for the third 12 weeks of 2003 includes a $2.9 million after-tax property impairment charge for Dominick’s and restructuring and other expenses totaling $6.0 million, after-tax.
(8) Net income for the second 12 weeks of 2003 includes a $41.6 million after-tax property impairment charge for Dominick’s and restructuring and other expenses totaling $9.9 million, after-tax.
(9) Net income for the first 12 weeks of 2003 includes a $6.4 million after-tax charge to adopt EITF No. 02-16, a $251.5 million after-tax goodwill impairment charge and a $28.3 million after-tax
property impairment charge for Dominick’s, partially offset by a tax benefit of $249.6 million related to the planned Dominick’s sale that was subsequently reversed in the fourth quarter of 2003.
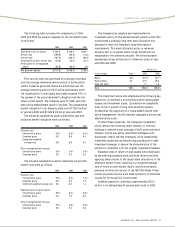
Note P: Quarterly Information (Unaudited)
The summarized quarterly financial data presented below reflect all adjustments which, in the opinion of management, are
of a normal and recurring nature necessary to present fairly the results of operations for the periods presented. (Rounding
affects some totals.)