Safeway 2011 Annual Report Download - page 103
Download and view the complete annual report
Please find page 103 of the 2011 Safeway annual report below. You can navigate through the pages in the report by either clicking on the pages listed below, or by using the keyword search tool below to find specific information within the annual report.-
 1
1 -
2
-
3
-
4
-
5
-
6
-
7
-
8
-
9
-
10
-
11
-
12
-
13
-
14
-
15
-
16
-
17
-
18
-
19
-
20
-
21
-
22
-
23
-
24
-
25
-
26
-
27
-
28
-
29
-
30
-
31
-
32
-
33
-
34
-
35
-
36
-
37
-
38
-
39
-
40
-
41
-
42
-
43
-
44
-
45
-
46
-
47
-
48
-
49
-
50
-
51
-
52
-
53
-
54
-
55
-
56
-
57
-
58
-
59
-
60
-
61
-
62
-
63
-
64
-
65
-
66
-
67
-
68
-
69
-
70
-
71
-
72
-
73
-
74
-
75
-
76
-
77
-
78
-
79
-
80
-
81
-
82
-
83
-
84
-
85
-
86
-
87
-
88
-
89
-
90
-
91
-
92
-
 93
93 -
 94
94 -
 95
95 -
 96
96 -
 97
97 -
 98
98 -
 99
99 -
 100
100 -
 101
101 -
 102
102 -
 103
103 -
 104
104 -
 105
105 -
 106
106 -
 107
107 -
 108
108
 |
 |

SAFEWAY INC. 2011 ANNUAL REPORT
Reconciliations
SAFEWAY INC. AND SUBSIDIARIES
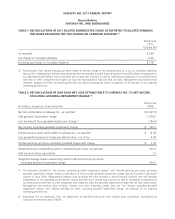
TABLE 1: RECONCILIATION OF 2011 DILUTED EARNINGS PER SHARE AS REPORTED TO DILUTED EARNINGS
PER SHARE EXCLUDING THE TAX CHARGE ON CANADIAN DIVIDEND (1)
Fiscal Year
2011
Diluted EPS
As reported $1.49
Tax charge on Canadian dividend 0.29
Excluding tax charge on Canadian dividend $1.78
(1) The exclusion from diluted earnings per share relates to the tax charge on the dividend paid to us by our Canadian subsidiary
during 2011. Management believes that excluding this item provides a useful financial measure that will facilitate comparisons of
our operating results before, during and after such charge was incurred, as well as facilitating comparisons of our performance
with that of other companies that might not have the organizational structure that we have. Management also believes that
investors, analysts and other interested parties view our diluted earnings per share, as adjusted, as an indicator of our ongoing
operating performance.
TABLE 2: RECONCILIATION OF 2009 GAAP NET LOSS ATTRIBUTABLE TO SAFEWAY INC. TO NET INCOME,
EXCLUDING GOODWILL IMPAIRMENT CHARGE (1)
(in millions, except per share amounts)
Fiscal Year
2009
Net loss attributable to Safeway Inc., as reported $(1,097.5)
Add goodwill impairment charge 1,974.2
Less tax benefit from goodwill impairment charge (2) (156.0)
Net income, excluding goodwill impairment charge $ 720.7
Diluted loss per share attributable to Safeway Inc., as reported $ (2.66)
Less goodwill impairment charge per diluted share, net of tax 4.40
Diluted earnings per share, excluding goodwill impairment charge $ 1.74
Weighted shares outstanding used for diluted loss per share, as reported 412.9
Add common share equivalents 1.2
Weighted average shares outstanding used for diluted earnings per share,
excluding goodwill impairment charge 414.1
(1) The exclusion included in “net income, excluding goodwill impairment charge” and “diluted earnings per share, excluding
goodwill impairment charge” relates to the effects of the non-cash goodwill impairment charge that we incurred in the fourth
quarter of fiscal 2009. Management believes that excluding this item provides a useful financial measure that will facilitate
comparisons of our operating results before, during and after such charge was incurred, as well as facilitating comparisons of
our performance with that of other companies that might not have the goodwill impairment charge that we have experienced.
Management also believes that investors, analysts and other interested parties view our “net income, excluding goodwill
impairment charge” and “diluted earnings per share, excluding goodwill impairment charge” as indicators of our ongoing
operating performance.
(2) Represents the tax deduction from the impairment of goodwill that arose from taxable asset acquisitions, tax-affected at
Safeway’s incremental rate of 38.6%.