Safeway 2011 Annual Report Download - page 41
Download and view the complete annual report
Please find page 41 of the 2011 Safeway annual report below. You can navigate through the pages in the report by either clicking on the pages listed below, or by using the keyword search tool below to find specific information within the annual report.-
 1
1 -
2
-
3
-
4
-
5
-
6
-
7
-
8
-
9
-
10
-
11
-
12
-
13
-
14
-
15
-
16
-
17
-
18
-
19
-
20
-
21
-
22
-
23
-
24
-
25
-
26
-
27
-
28
-
29
-
30
-
 31
31 -
 32
32 -
 33
33 -
 34
34 -
 35
35 -
 36
36 -
 37
37 -
 38
38 -
 39
39 -
 40
40 -
 41
41 -
 42
42 -
 43
43 -
 44
44 -
 45
45 -
 46
46 -
 47
47 -
 48
48 -
 49
49 -
 50
50 -
 51
51 -
52
-
53
-
54
-
55
-
56
-
57
-
58
-
59
-
60
-
61
-
62
-
63
-
64
-
65
-
66
-
67
-
68
-
69
-
70
-
71
-
72
-
73
-
74
-
75
-
76
-
77
-
78
-
79
-
80
-
81
-
82
-
83
-
84
-
85
-
86
-
87
-
88
-
89
-
90
-
91
-
92
-
93
-
94
-
95
-
96
-
97
-
98
-
99
-
100
-
101
-
102
-
103
-
104
-
105
-
106
-
107
-
108
 |
 |
SAFEWAY INC. AND SUBSIDIARIES
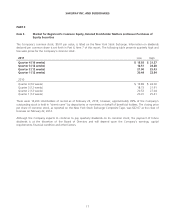
Gross profit margin was 27.03% of sales in 2011, 28.28% of sales in 2010 and 28.62% in 2009.
The gross profit margin decreased 125 basis points to 27.03% of sales in 2011 from 28.28% of sales in 2010. The impact
from fuel sales decreased gross profit margin 80 basis points. The remaining 45 basis-point decline was largely the result
of a 53 basis-point decline due to cost increases and investments in price, a 32 basis-point decline from the change in the
reporting for gift card commissions, a 16 basis-point decline resulting from LIFO expense, partly offset by a 34 basis-point
improvement in shrink and a 13 basis-point improvement from Blackhawk contributions.
The gross profit margin decreased 34 basis points to 28.28% of sales in 2010 from 28.62% of sales in 2009. The impact
from fuel sales decreased gross profit margin 27 basis points. The remaining seven basis-point decline was largely the
result of investments in everyday prices, partly offset by improvements in shrink.
Vendor allowances totaled $2.9 billion in 2011, $2.9 billion in 2010 and $2.6 billion in 2009. Vendor allowances can be
grouped into the following broad categories: promotional allowances, slotting allowances and contract allowances.
Promotional allowances make up more than 95% of all allowances. With promotional allowances, vendors pay Safeway
to promote their product. The promotion may be any combination of a temporary price reduction, a feature in print ads,
a feature in a Safeway circular or a preferred location in the store. The promotions are typically one to two weeks long.
Slotting allowances are a small portion of total allowances (approximately 3% of all allowances). With slotting
allowances, the vendor reimburses Safeway for the cost of placing new product on the shelf. Safeway has no obligation
or commitment to keep the product on the shelf for a minimum period.
Contract allowances make up the remainder of all allowances. Under a typical contract allowance, a vendor pays Safeway
to keep product on the shelf for a minimum period of time or when volume thresholds are achieved.
Promotional and slotting allowances are accounted for as a reduction in the cost of purchased inventory and recognized
when the related inventory is sold. Contract allowances are recognized as a reduction in the cost of goods sold as volume
thresholds are achieved or through the passage of time.
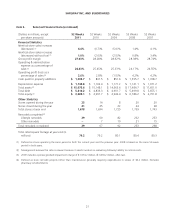
Operating and Administrative Expense Operating and administrative expense consists primarily of store occupancy
costs and backstage expenses, which, in turn, consist primarily of wages, employee benefits, rent, depreciation and
utilities.
Operating and administrative expense was 24.43% of sales in 2011 compared to 25.45% of sales in 2010 and 25.33%
in 2009.
Operating and administrative expense margin decreased 102 basis points to 24.43% of sales in 2011 from 25.45% of
sales in 2010. Higher fuel sales in 2011 decreased operating and administrative expense margin by 69 basis points. The
impact from the change related to gift card commissions reduced operating and administrative expense 28 basis points,
and net gains on property dispositions reduced operating and administrative expense 17 basis points.
Operating and administrative expense margin increased 12 basis points to 25.45% of sales in 2010 from 25.33% of sales
in 2009. Higher fuel sales in 2010 decreased operating and administrative expense margin by 31 basis points. The
offsetting 43-basis-point increase was primarily the result of higher labor costs, partly offset by net gains on property
dispositions.
Gain (Loss) on Property Dispositions Operating and administrative expense included a net gain on property dispositions
of $65.6 million in 2011, primarily consisting of a gain of $47.1 million on the sale of a distribution center in Burnaby,
British Columbia. Operating and administrative expense included a net gain of $27.5 million in 2010 and a net loss of
$12.7 million in 2009.
23