Safeway 2011 Annual Report Download - page 47
Download and view the complete annual report
Please find page 47 of the 2011 Safeway annual report below. You can navigate through the pages in the report by either clicking on the pages listed below, or by using the keyword search tool below to find specific information within the annual report.-
 1
1 -
2
-
3
-
4
-
5
-
6
-
7
-
8
-
9
-
10
-
11
-
12
-
13
-
14
-
15
-
16
-
17
-
18
-
19
-
20
-
21
-
22
-
23
-
24
-
25
-
26
-
27
-
28
-
29
-
30
-
31
-
32
-
33
-
34
-
35
-
36
-
 37
37 -
 38
38 -
 39
39 -
 40
40 -
 41
41 -
 42
42 -
 43
43 -
 44
44 -
 45
45 -
 46
46 -
 47
47 -
 48
48 -
 49
49 -
 50
50 -
 51
51 -
 52
52 -
 53
53 -
 54
54 -
 55
55 -
 56
56 -
 57
57 -
58
-
59
-
60
-
61
-
62
-
63
-
64
-
65
-
66
-
67
-
68
-
69
-
70
-
71
-
72
-
73
-
74
-
75
-
76
-
77
-
78
-
79
-
80
-
81
-
82
-
83
-
84
-
85
-
86
-
87
-
88
-
89
-
90
-
91
-
92
-
93
-
94
-
95
-
96
-
97
-
98
-
99
-
100
-
101
-
102
-
103
-
104
-
105
-
106
-
107
-
108
 |
 |

SAFEWAY INC. AND SUBSIDIARIES
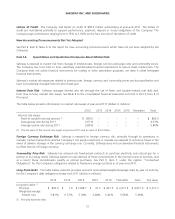
Dividends Declared on Common Stock The following table presents information regarding dividends declared on
Safeway’s common stock during fiscal 2011, 2010 and 2009.
(in millions, except per-share amounts)
Date
Declared
Record
Date
Per-Share
Amounts Total
Year-to-date
Total
2011
Quarter 4 12/07/11 12/22/11 $ 0.1450 $ 43.8 $ 187.6
Quarter 3 08/24/11 09/22/11 0.1450 49.3 143.8
Quarter 2 05/19/11 06/23/11 0.1450 50.7 94.5
Quarter 1 03/15/11 03/24/11 0.1200 43.8 43.8
2010
Quarter 4 12/07/10 12/23/10 $ 0.1200 $ 44.2 $ 173.5
Quarter 3 08/24/10 09/23/10 0.1200 44.7 129.3
Quarter 2 05/19/10 06/24/10 0.1200 45.8 84.6
Quarter 1 03/10/10 03/25/10 0.1000 38.8 38.8
2009
Quarter 4 12/10/09 12/24/09 $ 0.1000 $ 38.8 $ 156.3
Quarter 3 08/25/09 09/24/09 0.1000 40.6 117.5
Quarter 2 04/29/09 06/25/09 0.1000 41.6 76.9
Quarter 1 03/05/09 03/26/09 0.0828 35.3 35.3
Dividends Paid on Common Stock The following table presents information regarding dividends paid on Safeway’s
common stock during fiscal 2011, 2010 and 2009.
(in millions, except per-share amounts) Date Paid
Record
Date
Per-Share
Amounts Total
Year-to-date
Total
2011
Quarter 4 10/13/2011 9/22/2011 $ 0.1450 $ 49.3 $ 188.0
Quarter 3 7/14/2011 6/23/2011 0.1450 50.7 138.7
Quarter 2 4/14/2011 3/24/2011 0.1200 43.8 88.0
Quarter 1 1/13/2011 12/23/2010 0.1200 44.2 44.2
2010
Quarter 4 10/14/2010 9/23/2010 $ 0.1200 $ 44.7 $ 168.1
Quarter 3 7/15/2010 6/24/2010 0.1200 45.8 123.4
Quarter 2 4/15/2010 3/25/2010 0.1000 38.8 77.6
Quarter 1 1/14/2010 12/24/2009 0.1000 38.8 38.8
2009
Quarter 4 10/15/2009 9/24/2009 $ 0.1000 $ 40.6 $ 153.1
Quarter 3 7/16/2009 6/25/2009 0.1000 41.6 112.5
Quarter 2 4/16/2009 3/26/2009 0.0828 35.3 70.9
Quarter 1 1/14/2009 12/24/2008 0.0828 35.6 35.6
Stock Repurchase Program From the initiation of the Company’s stock repurchase program in 1999 through the end
of fiscal 2011, the aggregate cost of shares of common stock repurchased by the Company, including commissions, was
approximately $6.9 billion, leaving an authorized amount for repurchases of approximately $1.1 billion. During fiscal
2011, Safeway repurchased approximately 76.1 million shares of its common stock under the repurchase program at an
aggregate price, including commissions, of $1,588.2 million. This includes $34.2 million of common stock repurchases
29