Safeway 2011 Annual Report Download - page 5
Download and view the complete annual report
Please find page 5 of the 2011 Safeway annual report below. You can navigate through the pages in the report by either clicking on the pages listed below, or by using the keyword search tool below to find specific information within the annual report.-
 1
1 -
 2
2 -
 3
3 -
 4
4 -
 5
5 -
 6
6 -
 7
7 -
 8
8 -
 9
9 -
 10
10 -
 11
11 -
 12
12 -
 13
13 -
 14
14 -
 15
15 -
 16
16 -
17
-
18
-
19
-
20
-
21
-
22
-
23
-
24
-
25
-
26
-
27
-
28
-
29
-
30
-
31
-
32
-
33
-
34
-
35
-
36
-
37
-
38
-
39
-
40
-
41
-
42
-
43
-
44
-
45
-
46
-
47
-
48
-
49
-
50
-
51
-
52
-
53
-
54
-
55
-
56
-
57
-
58
-
59
-
60
-
61
-
62
-
63
-
64
-
65
-
66
-
67
-
68
-
69
-
70
-
71
-
72
-
73
-
74
-
75
-
76
-
77
-
78
-
79
-
80
-
81
-
82
-
83
-
84
-
85
-
86
-
87
-
88
-
89
-
90
-
91
-
92
-
93
-
94
-
95
-
96
-
97
-
98
-
99
-
100
-
101
-
102
-
103
-
104
-
105
-
106
-
107
-
108
 |
 |
Page 3
1
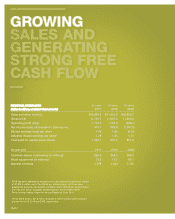
2011 has been adjusted to exclude a tax
expense of $98.9 million from the $1.1 billion
Canadian dividend paid in the first half of
2011. A reconciliation table follows the
Annual Report on Form 10-K.
2
The reconciliation table for free cash flow is
found on page 27 of the Annual Report on
Form 10-K.
We generated
strong free
cash flow of
$751 million2
in 2011 and
returned over
$1.7 billion to our
stockholders.
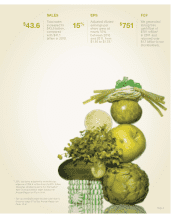
$751
Total sales
increased to
$43.6 billion,
compared
with $41.1
billion in 2010.
$43.6 Adjusted diluted
earnings per
share grew at
nearly 15%
between 2010
and 2011, from
$1.55 to $1.78.1
15%
EPSSALES FCF