Safeway 2011 Annual Report Download - page 93
Download and view the complete annual report
Please find page 93 of the 2011 Safeway annual report below. You can navigate through the pages in the report by either clicking on the pages listed below, or by using the keyword search tool below to find specific information within the annual report.-
 1
1 -
2
-
3
-
4
-
5
-
6
-
7
-
8
-
9
-
10
-
11
-
12
-
13
-
14
-
15
-
16
-
17
-
18
-
19
-
20
-
21
-
22
-
23
-
24
-
25
-
26
-
27
-
28
-
29
-
30
-
31
-
32
-
33
-
34
-
35
-
36
-
37
-
38
-
39
-
40
-
41
-
42
-
43
-
44
-
45
-
46
-
47
-
48
-
49
-
50
-
51
-
52
-
53
-
54
-
55
-
56
-
57
-
58
-
59
-
60
-
61
-
62
-
63
-
64
-
65
-
66
-
67
-
68
-
69
-
70
-
71
-
72
-
73
-
74
-
75
-
76
-
77
-
78
-
79
-
80
-
81
-
82
-
 83
83 -
 84
84 -
 85
85 -
 86
86 -
 87
87 -
 88
88 -
 89
89 -
 90
90 -
 91
91 -
 92
92 -
 93
93 -
 94
94 -
 95
95 -
 96
96 -
 97
97 -
 98
98 -
 99
99 -
 100
100 -
 101
101 -
 102
102 -
 103
103 -
104
-
105
-
106
-
107
-
108
 |
 |

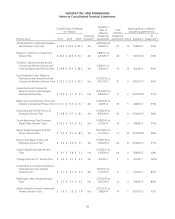
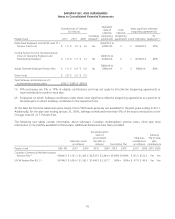
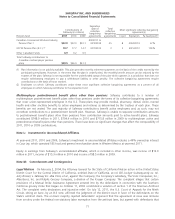
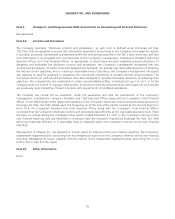
SAFEWAY INC. AND SUBSIDIARIES
Notes to Consolidated Financial Statements
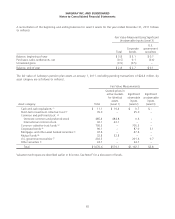
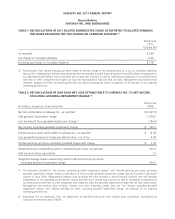
Note R: Quarterly Information (Unaudited)
The summarized quarterly financial data presented below reflect all adjustments, which in the opinion of management,
are of a normal and recurring nature necessary to present fairly the results of operations for the periods presented.
(Rounding affects some totals. In millions, except per-share amounts.)
52 Weeks
Last 16
Weeks
Third 12
Weeks
Second 12
Weeks
First 12
Weeks
2011
Sales and other revenue $ 43,630.2 $ 13,597.6 $ 10,064.3 $ 10,196.4 $ 9,772.0
Gross profit 11,793.7 3,632.4 2,717.2 2,753.0 2,691.1
Operating profit 1,134.6 390.1 248.3 277.0 219.2
Income before income taxes 882.1 309.7 196.3 218.9 157.2
Net income attributable to Safeway Inc. (1) 516.7 215.6 130.2 145.8 25.1
Income per common share attributable to
Safeway Inc.
Basic (1,2) $ 1.49 $ 0.67 $ 0.38 $ 0.42 $ 0.07
Diluted (1,2) 1.49 0.67 0.38 0.41 0.07
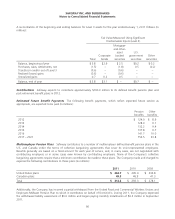
52 Weeks
Last 16
Weeks
Third 12
Weeks
Second 12
Weeks
First 12
Weeks
2010
Sales and other revenue $ 41,050.0 $ 12,803.7 $ 9,399.6 $ 9,519.5 $ 9,327.1
Gross profit 11,607.5 3,595.5 2,644.6 2,717.7 2,649.6
Operating profit 1,159.4 417.1 242.4 285.2 214.5
Income before income taxes 881.2 336.8 177.8 218.4 148.1
Net income attributable to Safeway Inc. 589.8 229.6 122.8 141.3 96.0
Income per common share attributable to
Safeway Inc.
Basic $ 1.56 $ 0.62 $ 0.33 $ 0.37 $ 0.25
Diluted 1.55 0.62 0.33 0.37 0.25
(1) In the first quarter of 2011, Safeway incurred an estimated tax charge of $80.2 million as a result of the decision to repatriate $1.1
billion from Safeway’s wholly-owned Canadian subsidiary.
(2) In the last 16 weeks of 2011, earnings per share benefited $0.06 from a reduction in weighted averaged diluted shares outstanding,
which was due to repurchases of common stock.
75