Safeway 2011 Annual Report Download - page 42
Download and view the complete annual report
Please find page 42 of the 2011 Safeway annual report below. You can navigate through the pages in the report by either clicking on the pages listed below, or by using the keyword search tool below to find specific information within the annual report.-
 1
1 -
2
-
3
-
4
-
5
-
6
-
7
-
8
-
9
-
10
-
11
-
12
-
13
-
14
-
15
-
16
-
17
-
18
-
19
-
20
-
21
-
22
-
23
-
24
-
25
-
26
-
27
-
28
-
29
-
30
-
31
-
 32
32 -
 33
33 -
 34
34 -
 35
35 -
 36
36 -
 37
37 -
 38
38 -
 39
39 -
 40
40 -
 41
41 -
 42
42 -
 43
43 -
 44
44 -
 45
45 -
 46
46 -
 47
47 -
 48
48 -
 49
49 -
 50
50 -
 51
51 -
 52
52 -
53
-
54
-
55
-
56
-
57
-
58
-
59
-
60
-
61
-
62
-
63
-
64
-
65
-
66
-
67
-
68
-
69
-
70
-
71
-
72
-
73
-
74
-
75
-
76
-
77
-
78
-
79
-
80
-
81
-
82
-
83
-
84
-
85
-
86
-
87
-
88
-
89
-
90
-
91
-
92
-
93
-
94
-
95
-
96
-
97
-
98
-
99
-
100
-
101
-
102
-
103
-
104
-
105
-
106
-
107
-
108
 |
 |
SAFEWAY INC. AND SUBSIDIARIES
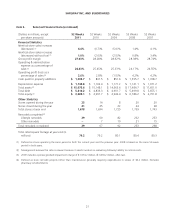
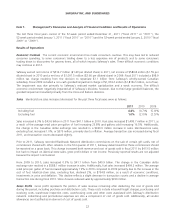
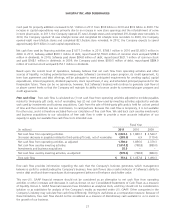
Interest Expense Interest expense was $272.2 million in 2011, compared to $298.5 million in 2010 and $331.7 million
in 2009. Interest expense decreased in 2011 and 2010 primarily due to a combination of lower average borrowings and a
lower average interest rate.
Other Income Other income consists primarily of interest income and equity in earnings (losses) from Safeway’s
unconsolidated affiliate. Interest income was $6.7 million in 2011, $4.4 million in 2010 and $2.3 million in 2009. Equity
in earnings of unconsolidated affiliate was $13.0 million in 2011, $15.3 million in 2010 and $8.5 million in 2009.
Income Taxes Income tax expense was $363.9 million, or 41.3% of pre-tax income, in 2011. In 2010, Safeway had
income tax expense of $290.6 million, or 33.0% of pre-tax income. Fiscal 2011 included a $98.9 million tax charge
resulting from the decision to repatriate $1.1 billion from Safeway’s wholly-owned Canadian subsidiary. In 2009, Safeway
had income tax expense of $144.2 million despite having a pre-tax loss of $953.3 million. The 2009 tax expense reflects
the tax effect of the goodwill impairment charge which is largely nondeductible for income tax purposes and, therefore,
increases the Company’s effective income tax rate. The impact of the goodwill impairment charge on the tax expense was
partly offset by a benefit of $74.9 million from the favorable resolution of various tax matters.
Critical Accounting Policies and Estimates
Critical accounting policies are those accounting policies that management believes are important to the portrayal of
Safeway’s financial condition and results of operations and require management’s most difficult, subjective or complex
judgments, often as a result of the need to make estimates about the effect of matters that are inherently uncertain.
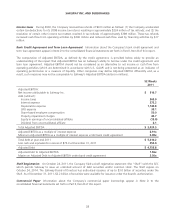
Workers’ Compensation The Company is primarily self-insured for workers’ compensation, automobile and general
liability costs. It is the Company’s policy to record its self-insurance liability as determined actuarially, based on claims filed
and an estimate of claims incurred but not yet reported.
Self-insurance reserves are actuarially determined primarily by applying historical paid loss and incurred loss development
trends to current cash and incurred expected losses in order to estimate total losses. We then discount total expected
losses to their present value using a risk free rate of return.
Any actuarial projection of self-insured losses is subject to a high degree of variability. For example, self-insurance expense
was $151.1 million in fiscal 2011, $148.3 million in fiscal 2010 and $128.8 million in 2009. Litigation trends, legal
interpretations, benefit level changes, claim settlement patterns and similar factors influenced historical development
trends that were used to determine the current year expense and therefore contributed to the variability in annual
expense. However, these factors are not direct inputs into the actuarial projection, and thus their individual impact cannot
be quantified.
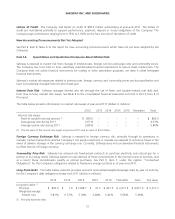
The discount rate is a significant factor that has led to variability in self-insured expenses. Since the discount rate is a
direct input into the estimation process, we are able to quantify its impact. The discount rate, which is based on the
United States Treasury Note rates for the estimated average claim life of five years, was 0.75% in 2011, 2.00% in 2010
and 2.75% in 2009. A 25-basis-point change in the discount rate affects the self-insured liability between $4 million and
$5 million.
The majority of the Company’s workers’ compensation liability is from claims occurring in California. California workers’
compensation has received intense scrutiny from the state’s politicians, insurers, employers and providers, as well as the
public in general. Recent years have seen escalation in the number of legislative reforms, judicial rulings and social
phenomena affecting this business. Some of the many sources of uncertainty in the Company’s reserve estimates include
changes in benefit levels, medical fee schedules, medical utilization guidelines, vocation rehabilitation and apportionment.
Store Lease Exit Costs and Impairment Charges Safeway assesses store impairment quarterly. Safeway’s policy is to
recognize losses relating to the impairment of long-lived assets when expected net future cash flows are less than the
assets’ carrying values. When stores that are under long-term leases close, Safeway records a liability for the future
24