Safeway 2011 Annual Report Download - page 45
Download and view the complete annual report
Please find page 45 of the 2011 Safeway annual report below. You can navigate through the pages in the report by either clicking on the pages listed below, or by using the keyword search tool below to find specific information within the annual report.-
 1
1 -
2
-
3
-
4
-
5
-
6
-
7
-
8
-
9
-
10
-
11
-
12
-
13
-
14
-
15
-
16
-
17
-
18
-
19
-
20
-
21
-
22
-
23
-
24
-
25
-
26
-
27
-
28
-
29
-
30
-
31
-
32
-
33
-
34
-
 35
35 -
 36
36 -
 37
37 -
 38
38 -
 39
39 -
 40
40 -
 41
41 -
 42
42 -
 43
43 -
 44
44 -
 45
45 -
 46
46 -
 47
47 -
 48
48 -
 49
49 -
 50
50 -
 51
51 -
 52
52 -
 53
53 -
 54
54 -
 55
55 -
56
-
57
-
58
-
59
-
60
-
61
-
62
-
63
-
64
-
65
-
66
-
67
-
68
-
69
-
70
-
71
-
72
-
73
-
74
-
75
-
76
-
77
-
78
-
79
-
80
-
81
-
82
-
83
-
84
-
85
-
86
-
87
-
88
-
89
-
90
-
91
-
92
-
93
-
94
-
95
-
96
-
97
-
98
-
99
-
100
-
101
-
102
-
103
-
104
-
105
-
106
-
107
-
108
 |
 |

SAFEWAY INC. AND SUBSIDIARIES
Cash paid for property additions increased to $1.1 billion in 2011 from $0.8 billion in 2010 and $0.9 billion in 2009. The
increase in capital expenditures was primarily due to an increase in new store openings and the refurbishment of some
in-store pharmacies. In 2011, the Company opened 25 new Lifestyle stores and completed 29 Lifestyle store remodels. In
2010, the Company opened 14 new Lifestyle stores and completed 60 Lifestyle store remodels. In 2009, the Company
opened eight new Lifestyle stores and completed 82 Lifestyle store remodels. In 2012, the Company expects to spend
approximately $0.9 billion in cash capital expenditures.
Net cash flow used by financing activities was $1,077.3 million in 2011, $768.1 million in 2010 and $1,600.3 million in
2009. In 2011, Safeway added $609.1 million of debt, repurchased $1,554.0 million of common stock and paid $188.0
million in dividends. In 2010, Safeway paid down $84.8 million of debt, repurchased $621.1 million of common stock
and paid $168.1 million in dividends. In 2009, the Company paid down $599.5 million of debt, repurchased $884.9
million of common stock and paid $153.1 million in dividends.
Based upon the current level of operations, Safeway believes that net cash flow from operating activities and other
sources of liquidity, including potential borrowing under Safeway’s commercial paper program, its credit agreement, its
term loan agreement and debt offerings, will be adequate to meet anticipated requirements for working capital, capital
expenditures, interest payments, dividend payments, stock repurchases, if any, and scheduled principal payments for the
foreseeable future. There can be no assurance, however, that Safeway’s business will continue to generate cash flow at
or above current levels or that the Company will maintain its ability to borrow under its commercial paper program and
credit agreements.
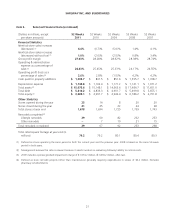
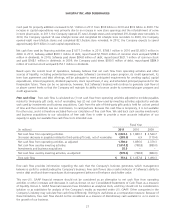
Free cash flow Free cash flow is calculated as (1) net cash flow from operating activities adjusted to exclude payables
related to third-party gift cards, net of receivables, less (2) net cash flow used by investing activities adjusted to exclude
cash used by investments and business acquisitions. Cash from the sale of third-party gift cards is held for a short period
of time and then remitted, less our commission, to card partners. Because this cash flow is temporary, it is not available
for other uses, and it is therefore excluded from our calculation of free cash flow. We add back cash used by investments
and business acquisitions to our calculation of free cash flow in order to provide a more accurate indication of our
capacity to apply our available free cash flow to its intended uses.
Fiscal Year
(in millions) 2011 2010 2009
Net cash flow from operating activities $ 2,023.6 $ 1,849.7 $ 2,549.7
(Increase) decrease in payables related to third-party gift cards, net of receivables (293.6) 6.9 (170.4)
Net cash flow from operating activities, as adjusted 1,730.0 1,856.6 2,379.3
Net cash flow used by investing activities (1,014.5) (798.8) (889.0)
Investments and business acquisitions 35.9 ––
Net cash flow used by investing activities, as adjusted (978.6) (798.8) (889.0)
Free cash flow $ 751.4 $ 1,057.8 $ 1,490.3
Free cash flow provides information regarding the cash that the Company’s business generates, which management
believes is useful to understanding the Company’s business. Free cash flow is also a useful indicator of Safeway’s ability to
service debt and fund share repurchases that management believes will enhance stockholder value.
This non-U.S. GAAP financial measure should not be considered as an alternative to net cash flow from operating
activities or other increases and decreases in cash as shown on our Consolidated Statements of Cash Flows as a measure
of liquidity. Non-U.S. GAAP financial measures have limitations as analytical tools, and they should not be considered in
isolation or as substitutes for analysis of the Company’s results as reported under U.S. GAAP. Other companies in the
Company’s industry may calculate free cash flow differently, limiting its usefulness as a comparative measure. Because of
these limitations, free cash flow should not be considered as a measure of discretionary cash available to us to invest in
the growth of our business.
27