Safeway 2011 Annual Report Download - page 6
Download and view the complete annual report
Please find page 6 of the 2011 Safeway annual report below. You can navigate through the pages in the report by either clicking on the pages listed below, or by using the keyword search tool below to find specific information within the annual report.-
 1
1 -
 2
2 -
 3
3 -
 4
4 -
 5
5 -
 6
6 -
 7
7 -
 8
8 -
 9
9 -
 10
10 -
 11
11 -
 12
12 -
 13
13 -
 14
14 -
 15
15 -
 16
16 -
 17
17 -
18
-
19
-
20
-
21
-
22
-
23
-
24
-
25
-
26
-
27
-
28
-
29
-
30
-
31
-
32
-
33
-
34
-
35
-
36
-
37
-
38
-
39
-
40
-
41
-
42
-
43
-
44
-
45
-
46
-
47
-
48
-
49
-
50
-
51
-
52
-
53
-
54
-
55
-
56
-
57
-
58
-
59
-
60
-
61
-
62
-
63
-
64
-
65
-
66
-
67
-
68
-
69
-
70
-
71
-
72
-
73
-
74
-
75
-
76
-
77
-
78
-
79
-
80
-
81
-
82
-
83
-
84
-
85
-
86
-
87
-
88
-
89
-
90
-
91
-
92
-
93
-
94
-
95
-
96
-
97
-
98
-
99
-
100
-
101
-
102
-
103
-
104
-
105
-
106
-
107
-
108
 |
 |
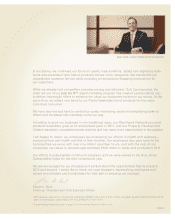
Dear Fellow Stockholders,
In 2011, we focused on building loyalty to drive sales, continued to control costs and utilized
our strong free cash flow and balance sheet strength to enhance stockholder value. At the
same time, we continued to make progress with new business initiatives to drive future growth.
During the year, we achieved four quarters of positive identical-store sales (excluding fuel),
and we grew adjusted diluted earnings per share by 14.8%.1
These achievements came in a year of higher-than-expected inflation, unemployment and fuel
prices—all of which impacted consumer behavior. In keeping with our industry counterparts,
we were able to pass along the majority of cost increases, while remaining competitive.
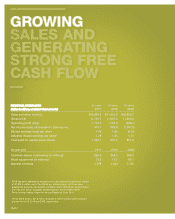
Total sales reached $43.6 billion in 2011, 6.3% higher than in 2010. Excluding fuel, identical-
store sales increased 1.0%, compared to a 2.0% decrease in 2010.
Net income for 2011 was $516.7 million, equal to $1.49 per diluted share, compared with
$589.8 million, or $1.55 per diluted share, in 2010. We paid taxes to repatriate cash from
Canada, which lowered net income in 2011. Excluding the tax charge of $0.29 per diluted
share, adjusted diluted earnings per share was $1.78.1
We generated free cash flow of $751 million2 in 2011 and returned over $1.7 billion to our
stockholders through approximately $1.55 billion in stock repurchases and $188 million in
dividends. We capitalized on low interest rates and a low stock price environment, increasing
our debt at the end of 2011 to allow for an increase in our stock repurchases.
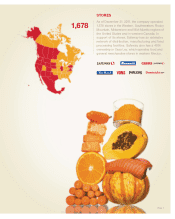
During 2011, we opened 25 new stores, completed 29 Lifestyle remodels and closed 41 stores,
which brought our store base to 1,678 locations at year-end. With the majority of the Lifestyle
remodels now behind us, we will begin to allocate some of our cash flow to other opportunities.
Page 4