Safeway 2011 Annual Report Download - page 62
Download and view the complete annual report
Please find page 62 of the 2011 Safeway annual report below. You can navigate through the pages in the report by either clicking on the pages listed below, or by using the keyword search tool below to find specific information within the annual report.-
 1
1 -
2
-
3
-
4
-
5
-
6
-
7
-
8
-
9
-
10
-
11
-
12
-
13
-
14
-
15
-
16
-
17
-
18
-
19
-
20
-
21
-
22
-
23
-
24
-
25
-
26
-
27
-
28
-
29
-
30
-
31
-
32
-
33
-
34
-
35
-
36
-
37
-
38
-
39
-
40
-
41
-
42
-
43
-
44
-
45
-
46
-
47
-
48
-
49
-
50
-
51
-
 52
52 -
 53
53 -
 54
54 -
 55
55 -
 56
56 -
 57
57 -
 58
58 -
 59
59 -
 60
60 -
 61
61 -
 62
62 -
 63
63 -
 64
64 -
 65
65 -
 66
66 -
 67
67 -
 68
68 -
 69
69 -
 70
70 -
 71
71 -
 72
72 -
73
-
74
-
75
-
76
-
77
-
78
-
79
-
80
-
81
-
82
-
83
-
84
-
85
-
86
-
87
-
88
-
89
-
90
-
91
-
92
-
93
-
94
-
95
-
96
-
97
-
98
-
99
-
100
-
101
-
102
-
103
-
104
-
105
-
106
-
107
-
108
 |
 |

SAFEWAY INC. AND SUBSIDIARIES
Notes to Consolidated Financial Statements
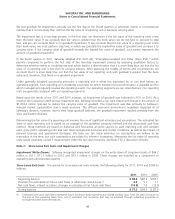
Cost of Goods Sold Cost of goods sold includes cost of inventory sold during the period, including purchase and
distribution costs. These costs include inbound freight charges, purchasing and receiving costs, warehouse inspection
costs, warehousing costs and other costs of Safeway’s distribution network. All vendor allowances are classified as an
element of cost of goods sold. Advertising and promotional expenses are also included as a component of cost of goods
sold. Such costs are expensed in the period the advertisement occurs. Advertising and promotional expenses totaled
$491.3 million in 2011, $508.7 million in 2010 and $502.9 million in 2009.
Cash and Equivalents Cash and equivalents include short-term investments with original maturities of less than three
months and credit and debit card sales transactions which settle within a few business days of year end.
Book overdrafts at year-end 2011 and 2010 of $1.2 million and $90.1 million, respectively, are included in accounts payable.
Receivables Receivables include pharmacy, gift card receivables and miscellaneous trade receivables.
Merchandise Inventories Merchandise inventory of $1,608 million at year-end 2011 and $1,685 million at year-end
2010 is valued at the lower of cost on a last-in, first-out (“LIFO”) basis or market value. Such LIFO inventory had a
replacement or current cost of $1,678 million at year-end 2011 and $1,720 million at year-end 2010. Liquidations of LIFO
layers during the three years reported did not have a material effect on the results of operations. All remaining inventory
is valued at the lower of cost on a first-in, first-out (“FIFO”) basis or market value. The FIFO cost of inventory
approximates replacement or current cost. The Company performs physical counts of perishable inventory in stores every
four weeks and nonperishable inventory in stores and all distribution centers twice a year. The Company uses a
combination of the retail inventory method and cost method to determine the cost of its inventory before any LIFO
reserve is applied. The Company records an inventory shrink adjustment upon physical counts and also provides for
estimated inventory shrink adjustments for the period between the last physical inventory and each balance sheet date.
Property and Depreciation Property is stated at cost. Depreciation expense on buildings and equipment is computed
on the straight-line method using the following lives:
Stores and other buildings 7 to 40 years
Fixtures and equipment 3 to 15 years
Property under capital leases and leasehold improvements is amortized on a straight-line basis over the shorter of the
remaining terms of the leases or the estimated useful lives of the assets.
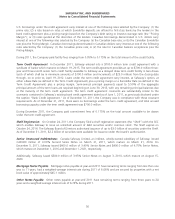
Employee Benefit Plans The Company recognizes in its statement of financial position an asset for its employee
benefit plan’s overfunded status or a liability for underfunded status. The Company measures plan assets and obligations
that determine the funded status as of fiscal year end. See Note K.
Self-Insurance The Company is primarily self-insured for workers’ compensation, automobile and general liability costs.
The self-insurance liability is determined actuarially, based on claims filed and an estimate of claims incurred but not yet
reported, and is discounted using a risk-free rate of interest. The present value of such claims was calculated using a
discount rate of 0.75% in 2011, 2.00% in 2010 and 2.75% in 2009.
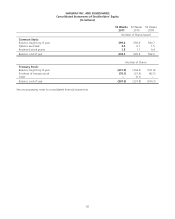
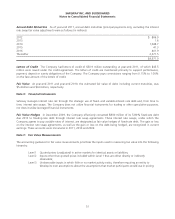
A summary of changes in Safeway’s self-insurance liability is as follows (in millions):
2011 2010 2009
Beginning balance $ 468.5 $ 453.8 $ 487.8
Expense 151.1 148.3 128.8
Claim payments (148.6) (134.0) (163.4)
Currency translation (0.1) 0.4 0.6
Ending balance 470.9 468.5 453.8
Less current portion (129.4) (129.5) (131.7)
Long-term portion $ 341.5 $ 339.0 $ 322.1
44