Safeway 2011 Annual Report Download - page 4
Download and view the complete annual report
Please find page 4 of the 2011 Safeway annual report below. You can navigate through the pages in the report by either clicking on the pages listed below, or by using the keyword search tool below to find specific information within the annual report.-
 1
1 -
 2
2 -
 3
3 -
 4
4 -
 5
5 -
 6
6 -
 7
7 -
 8
8 -
 9
9 -
 10
10 -
 11
11 -
 12
12 -
 13
13 -
 14
14 -
 15
15 -
16
-
17
-
18
-
19
-
20
-
21
-
22
-
23
-
24
-
25
-
26
-
27
-
28
-
29
-
30
-
31
-
32
-
33
-
34
-
35
-
36
-
37
-
38
-
39
-
40
-
41
-
42
-
43
-
44
-
45
-
46
-
47
-
48
-
49
-
50
-
51
-
52
-
53
-
54
-
55
-
56
-
57
-
58
-
59
-
60
-
61
-
62
-
63
-
64
-
65
-
66
-
67
-
68
-
69
-
70
-
71
-
72
-
73
-
74
-
75
-
76
-
77
-
78
-
79
-
80
-
81
-
82
-
83
-
84
-
85
-
86
-
87
-
88
-
89
-
90
-
91
-
92
-
93
-
94
-
95
-
96
-
97
-
98
-
99
-
100
-
101
-
102
-
103
-
104
-
105
-
106
-
107
-
108
 |
 |
Page 2
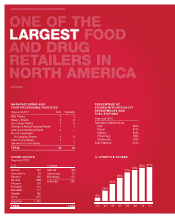
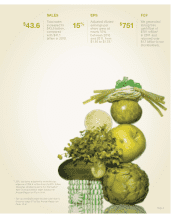
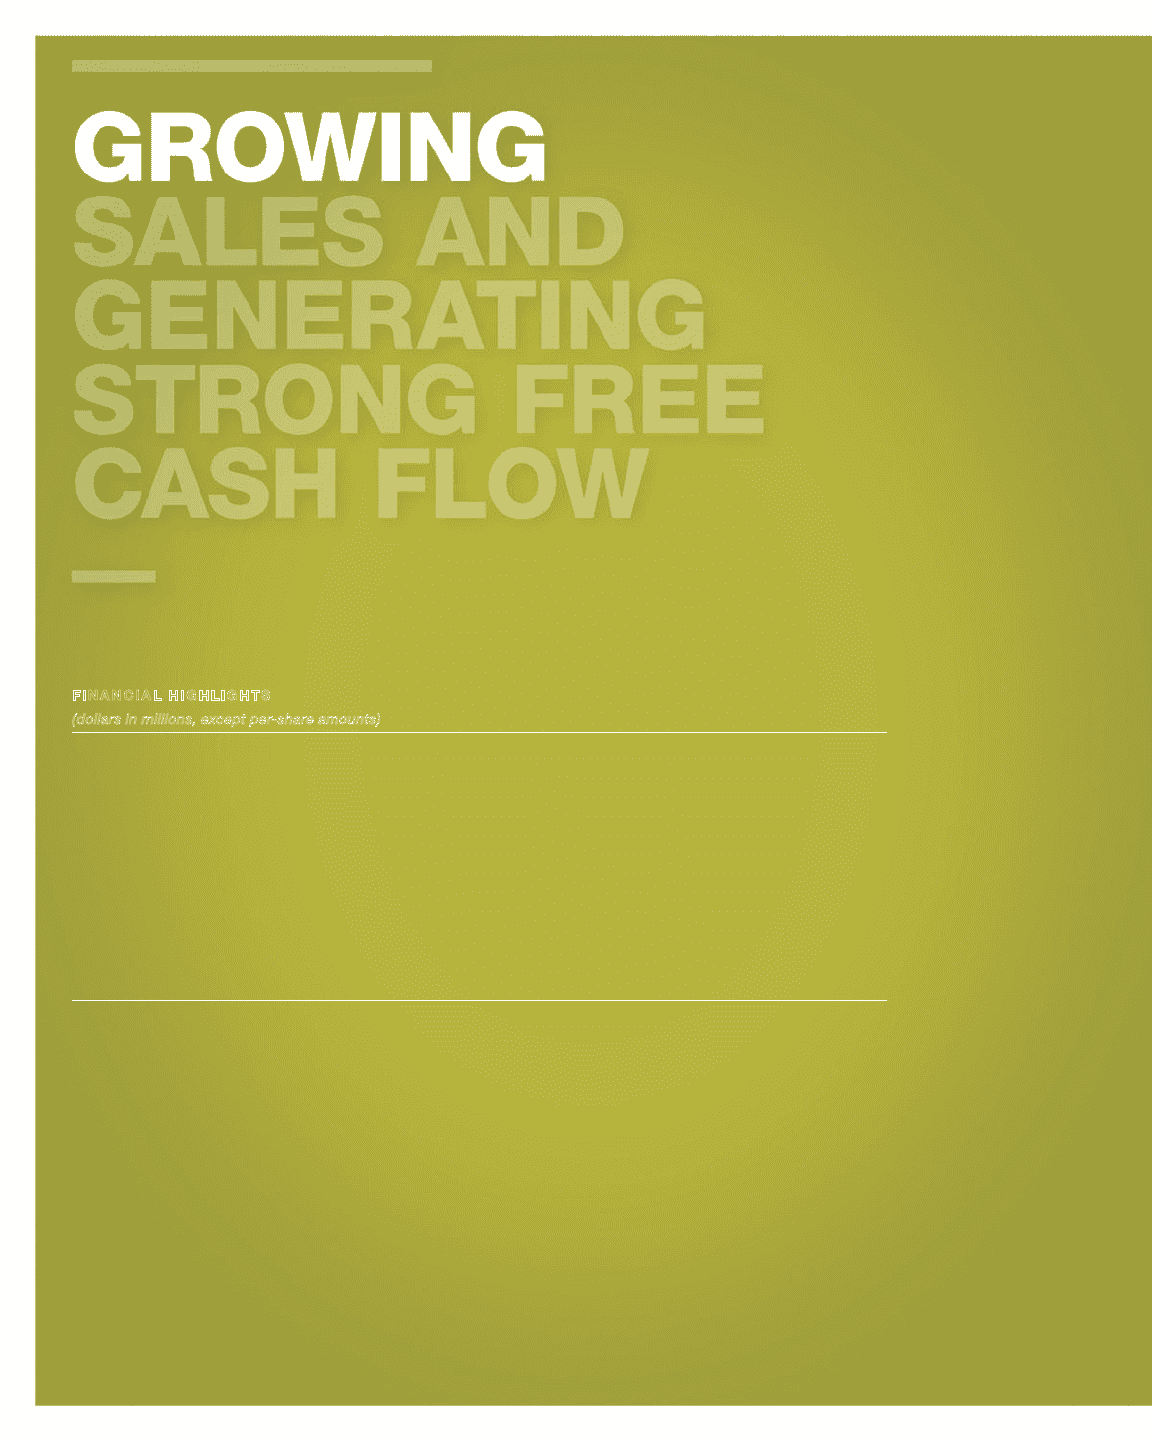
FINANCIAL HIGHLIGHTS
(dollars in millions, except per-share amounts)
52 weeks
2011
52 weeks
2010
52 weeks
2009
Sales and other revenue $ 43,630.2 $ 41,050.0 $ 40,850.7
Gross profit 11,793.7 11,607.5 11,693.5
Operating profit (loss) 1,134.6 1,159.4 (628.7)
Net income (loss) attributable to Safeway Inc. 516.7 589.8 (1,097.5)
Diluted earnings (loss) per share 1.49 1.55 (2.66)
Adjusted diluted earnings per share11.78 1.55 1.74
Cash paid for capital expenditures 1,094.7 837.5 851.6
At year-end 2011 2010 2009
Common shares outstanding (in millions)2296.6 368.0 388.3
Retail square feet (in millions) 79.2 79.2 80.1
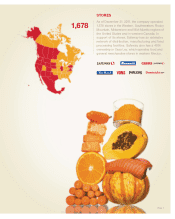
Number of stores 1,678 1,694 1,725
1 2009 has been adjusted to exclude a non-cash goodwill impairment charge
of $1,818.2 million, net of tax ($4.40 per diluted share). 2011 has been
adjusted to exclude a tax expense of $98.9 million ($0.29 per diluted share)
from the $1.1 billion Canadian dividend paid in the first half of 2011.
Reconciliation tables follow the Annual Report on Form 10-K.
2
Net of 307.9 million, 231.8 million and 204.3 million shares held in treasury
at year-end 2011, 2010 and 2009, respectively.