Safeway 2011 Annual Report Download - page 92
Download and view the complete annual report
Please find page 92 of the 2011 Safeway annual report below. You can navigate through the pages in the report by either clicking on the pages listed below, or by using the keyword search tool below to find specific information within the annual report.-
 1
1 -
2
-
3
-
4
-
5
-
6
-
7
-
8
-
9
-
10
-
11
-
12
-
13
-
14
-
15
-
16
-
17
-
18
-
19
-
20
-
21
-
22
-
23
-
24
-
25
-
26
-
27
-
28
-
29
-
30
-
31
-
32
-
33
-
34
-
35
-
36
-
37
-
38
-
39
-
40
-
41
-
42
-
43
-
44
-
45
-
46
-
47
-
48
-
49
-
50
-
51
-
52
-
53
-
54
-
55
-
56
-
57
-
58
-
59
-
60
-
61
-
62
-
63
-
64
-
65
-
66
-
67
-
68
-
69
-
70
-
71
-
72
-
73
-
74
-
75
-
76
-
77
-
78
-
79
-
80
-
81
-
 82
82 -
 83
83 -
 84
84 -
 85
85 -
 86
86 -
 87
87 -
 88
88 -
 89
89 -
 90
90 -
 91
91 -
 92
92 -
 93
93 -
 94
94 -
 95
95 -
 96
96 -
 97
97 -
 98
98 -
 99
99 -
 100
100 -
 101
101 -
 102
102 -
103
-
104
-
105
-
106
-
107
-
108
 |
 |

SAFEWAY INC. AND SUBSIDIARIES
Notes to Consolidated Financial Statements
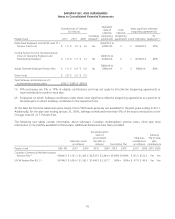
Historically, the Company computed earnings per share under the treasury stock method as the impact of participating
securities did not change earnings per share prior to 2011.
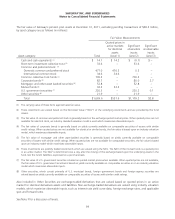
The following table provides reconciliations of net earnings and shares used in calculating income per basic common
share to those used in calculating income per diluted common share.
(In millions, except per-share amounts) 2011 2010 2009
Diluted Basic Diluted Basic Diluted Basic
Net income (loss) attributable to Safeway Inc. $516.7 $516.7 $589.8 $589.8 $(1,097.5) $(1,097.5)
Distributed and undistributed earnings allocated to
participating securities (3.8) (3.8) ––––
Net income (loss) available to common stockholders $512.9 $512.9 $589.8 $589.8 $(1,097.5) $(1,097.5)
Weighted-average common shares outstanding 343.4 343.4 378.3 378.3 412.9 412.9
Common share equivalents 0.4 1.3
Weighted-average shares outstanding 343.8 379.6
Income (loss) per share $ 1.49 $ 1.49 $ 1.55 $ 1.56 $ (2.66) $ (2.66)
Anti-dilutive shares totaling 25.1 million in 2011, 26.4 million in 2010 and 42.5 million in 2009 have been excluded from diluted
weighted-average shares outstanding.
Note P: Guarantees
Safeway applies the accounting guidance for guarantees to the Company’s agreements that contain guarantee and
indemnification clauses. This guidance requires that, upon issuance of a guarantee, the guarantor must disclose and
recognize a liability for the fair value of the obligation it assumes under the guarantee. As of December 31, 2011,
Safeway did not have any material guarantees.
However, the Company is party to a variety of contractual agreements under which Safeway may be obligated to
indemnify the other party for certain matters. These contracts primarily relate to Safeway’s commercial contracts,
operating leases and other real estate contracts, trademarks, intellectual property, financial agreements and various other
agreements. Under these agreements, the Company may provide certain routine indemnifications relating to
representations and warranties (for example, ownership of assets, environmental or tax indemnifications) or personal
injury matters. The terms of these indemnifications range in duration and may not be explicitly defined. Historically,
Safeway has not made significant payments for these indemnifications. The Company believes that if it were to incur a
loss in any of these matters, the loss would not have a material effect on the Company’s financial condition or results of
operations.
Note Q: Subsequent Event
In January 2012, Safeway announced the sale of 16 of its Genuardi’s stores, located in the Eastern United States. The
transaction is subject to customary closing conditions, including regulatory approval. The after-tax gain on the sale will be
recorded as a discontinued operation in the statement of operations when the transaction closes. Assets of these stores
totaled $63.3 million and were reclassed to assets held for sale and included in Prepaid Expenses and Other Current
Assets as of year-end 2011. Liabilities of these stores totaling $25.0 million were reclassed to liabilities held for sale and
included in Other Accrued Liabilities. The operating results of these stores have not been reflected in discontinued
operations because the historical financial operating results were not material to the Company’s consolidated financial
statements for all periods presented. Additionally, Safeway plans to close four Genuardi’s stores and sell the remaining
seven Genuardi’s stores, which will continue to operate while Safeway works with potential buyers.
74