Safeway 2011 Annual Report Download - page 69
Download and view the complete annual report
Please find page 69 of the 2011 Safeway annual report below. You can navigate through the pages in the report by either clicking on the pages listed below, or by using the keyword search tool below to find specific information within the annual report.-
 1
1 -
2
-
3
-
4
-
5
-
6
-
7
-
8
-
9
-
10
-
11
-
12
-
13
-
14
-
15
-
16
-
17
-
18
-
19
-
20
-
21
-
22
-
23
-
24
-
25
-
26
-
27
-
28
-
29
-
30
-
31
-
32
-
33
-
34
-
35
-
36
-
37
-
38
-
39
-
40
-
41
-
42
-
43
-
44
-
45
-
46
-
47
-
48
-
49
-
50
-
51
-
52
-
53
-
54
-
55
-
56
-
57
-
58
-
 59
59 -
 60
60 -
 61
61 -
 62
62 -
 63
63 -
 64
64 -
 65
65 -
 66
66 -
 67
67 -
 68
68 -
 69
69 -
 70
70 -
 71
71 -
 72
72 -
 73
73 -
 74
74 -
 75
75 -
 76
76 -
 77
77 -
 78
78 -
 79
79 -
80
-
81
-
82
-
83
-
84
-
85
-
86
-
87
-
88
-
89
-
90
-
91
-
92
-
93
-
94
-
95
-
96
-
97
-
98
-
99
-
100
-
101
-
102
-
103
-
104
-
105
-
106
-
107
-
108
 |
 |

SAFEWAY INC. AND SUBSIDIARIES
Notes to Consolidated Financial Statements
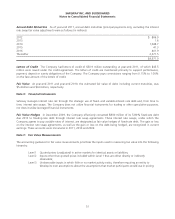
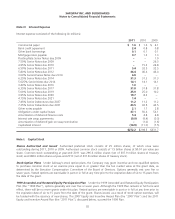
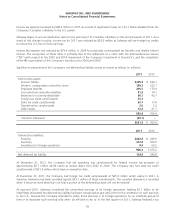
Annual Debt Maturities As of year-end 2011, annual debt maturities (principal payments only, excluding the interest
rate swap fair value adjustment) were as follows (in millions):
2012 $ 806.9
2013 1.6
2014 1,048.7
2015 41.3
2016 401.9
Thereafter 2,671.5
$4,971.9
Letters of Credit The Company had letters of credit of $50.9 million outstanding at year-end 2011, of which $43.5
million were issued under the credit agreement. The letters of credit are maintained primarily to support performance,
payment, deposit or surety obligations of the Company. The Company pays commissions ranging from 0.15% to 1.00%
on the face amount of the letters of credit.
Fair Value At year-end 2011 and year-end 2010, the estimated fair value of debt, including current maturities, was
$5.4 billion and $4.6 billion, respectively.
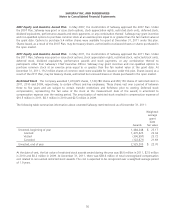
Note E: Financial Instruments
Safeway manages interest rate risk through the strategic use of fixed- and variable-interest rate debt and, from time to
time, interest rate swaps. The Company does not utilize financial instruments for trading or other speculative purposes,
nor does it utilize leveraged financial instruments.
Fair Value Hedges In December 2009, the Company effectively converted $800 million of its 5.80% fixed-rate debt
due 2012 to floating-rate debt through interest rate swap agreements. These interest rate swaps, under which the
Company agrees to pay variable rates of interest, are designated as fair value hedges of fixed-rate debt. The gain or loss
on the interest rate swap agreements, as well as the gain or loss on the debt being hedged, are recognized in current
earnings. These amounts were immaterial in 2011, 2010 and 2009.
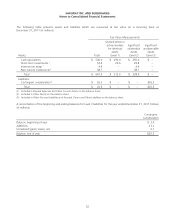
Note F: Fair Value Measurements
The accounting guidance for fair value measurements prioritizes the inputs used in measuring fair value into the following
hierarchy:
Level 1 Quoted prices (unadjusted) in active markets for identical assets or liabilities;
Level 2 Inputs other than quoted prices included within Level 1 that are either directly or indirectly
observable;
Level 3 Unobservable inputs in which little or no market activity exists, therefore requiring an entity to
develop its own assumptions about the assumptions that market participants would use in pricing.
51