Safeway 2011 Annual Report Download - page 40
Download and view the complete annual report
Please find page 40 of the 2011 Safeway annual report below. You can navigate through the pages in the report by either clicking on the pages listed below, or by using the keyword search tool below to find specific information within the annual report.-
 1
1 -
2
-
3
-
4
-
5
-
6
-
7
-
8
-
9
-
10
-
11
-
12
-
13
-
14
-
15
-
16
-
17
-
18
-
19
-
20
-
21
-
22
-
23
-
24
-
25
-
26
-
27
-
28
-
29
-
 30
30 -
 31
31 -
 32
32 -
 33
33 -
 34
34 -
 35
35 -
 36
36 -
 37
37 -
 38
38 -
 39
39 -
 40
40 -
 41
41 -
 42
42 -
 43
43 -
 44
44 -
 45
45 -
 46
46 -
 47
47 -
 48
48 -
 49
49 -
 50
50 -
51
-
52
-
53
-
54
-
55
-
56
-
57
-
58
-
59
-
60
-
61
-
62
-
63
-
64
-
65
-
66
-
67
-
68
-
69
-
70
-
71
-
72
-
73
-
74
-
75
-
76
-
77
-
78
-
79
-
80
-
81
-
82
-
83
-
84
-
85
-
86
-
87
-
88
-
89
-
90
-
91
-
92
-
93
-
94
-
95
-
96
-
97
-
98
-
99
-
100
-
101
-
102
-
103
-
104
-
105
-
106
-
107
-
108
 |
 |

SAFEWAY INC. AND SUBSIDIARIES
Item 7. Management’s Discussion and Analysis of Financial Condition and Results of Operations
The last three fiscal years consist of the 52-week period ended December 31, 2011 (“fiscal 2011” or “2011”), the
52-week period ended January 1, 2011 (“fiscal 2010” or “2010”) and the 52-week period ended January 2, 2010 (“fiscal
2009” or “2009”).
Results of Operations
Economic Outlook The current economic environment has made consumers cautious. This may have led to reduced
consumer spending, to some consumers trading down to a less expensive mix of products and to some consumers
trading down to discounters for grocery items, all of which impacts Safeway’s sales. These difficult economic conditions
may continue in 2012.
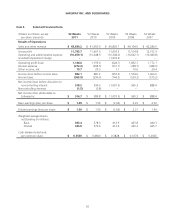
Safeway earned net income of $516.7 million ($1.49 per diluted share) in 2011, net income of $589.8 million ($1.55 per
diluted share) in 2010 and a net loss of $1,097.5 million ($2.66 per diluted share) in 2009. Fiscal 2011 included a $98.9
million tax charge resulting from the decision to repatriate $1.1 billion from Safeway’s wholly-owned Canadian
subsidiary. Fiscal 2009 included a non-cash goodwill impairment charge of $1,974.2 million ($1,818.2 million, net of tax).
The impairment was due primarily to Safeway’s reduced market capitalization and a weak economy. The difficult
economic environment negatively impacted all of Safeway’s divisions; however, due to their large goodwill balances, the
goodwill impairment resulted primarily from the Vons and Eastern divisions.
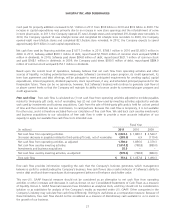
Sales Identical-store sales increases (decreases) for the past three fiscal years were as follows:
2011 2010 2009
Including fuel 4.4% (0.7)% (5.0)%
Excluding fuel 1.0% (2.0)% (2.5)%
Sales increased 6.3% to $43.6 billion in 2011 from $41.1 billion in 2010. Fuel sales increased $1,408.7 million in 2011, as
a result of the average retail price per gallon of fuel increasing 23.8% and gallons sold increasing 16.5%. Additionally,
the change in the Canadian dollar exchange rate resulted in a $240.0 million increase in sales. Identical-store sales,
excluding fuel, increased 1.0%, or $375 million, primarily due to inflation. Average transaction size increased during fiscal
2011, and transaction counts decreased slightly.
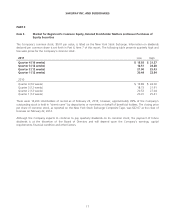
Prior to 2011, Safeway recorded Blackhawk Network distribution commissions on the sale of certain gift cards, net of
commissions shared with other retailers. In the first quarter of 2011, Safeway determined that these commissions should
be reported on a gross basis. This change increased both revenue and cost of goods sold in fiscal 2011 by $413.5 million
but had no impact on identical-store sales, gross profit dollars or net income. Previously reported results are not adjusted
because the impact is immaterial.
From 2009 to 2010, sales increased 0.5% to $41.1 billion from $40.9 billion. The change in the Canadian dollar
exchange rate resulted in a $588.1 million increase in sales. Additionally, fuel sales increased $499.2 million. The average
retail price per gallon of fuel increased approximately 19% in 2010 compared to 2009 primarily due to the increase in the
cost of fuel. Identical-store sales, excluding fuel, declined 2%, or $734.8 million, as a result of economic conditions,
investments in price and deflation. This decline reflects a slight decrease in transaction counts and a decline in average
transaction size during fiscal 2010. Store closures reduced sales by approximately $230 million.
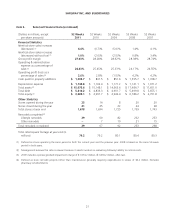
Gross Profit Gross profit represents the portion of sales revenue remaining after deducting the cost of goods sold
during the period, including purchase and distribution costs. These costs include inbound freight charges, purchasing and
receiving costs, warehouse inspection costs, warehousing costs and other costs associated with Safeway’s distribution
network. Advertising and promotional expenses are also a component of cost of goods sold. Additionally, all vendor
allowances are classified as an element of cost of goods sold.
22