Safeway 2011 Annual Report Download - page 43
Download and view the complete annual report
Please find page 43 of the 2011 Safeway annual report below. You can navigate through the pages in the report by either clicking on the pages listed below, or by using the keyword search tool below to find specific information within the annual report.-
 1
1 -
2
-
3
-
4
-
5
-
6
-
7
-
8
-
9
-
10
-
11
-
12
-
13
-
14
-
15
-
16
-
17
-
18
-
19
-
20
-
21
-
22
-
23
-
24
-
25
-
26
-
27
-
28
-
29
-
30
-
31
-
32
-
 33
33 -
 34
34 -
 35
35 -
 36
36 -
 37
37 -
 38
38 -
 39
39 -
 40
40 -
 41
41 -
 42
42 -
 43
43 -
 44
44 -
 45
45 -
 46
46 -
 47
47 -
 48
48 -
 49
49 -
 50
50 -
 51
51 -
 52
52 -
 53
53 -
54
-
55
-
56
-
57
-
58
-
59
-
60
-
61
-
62
-
63
-
64
-
65
-
66
-
67
-
68
-
69
-
70
-
71
-
72
-
73
-
74
-
75
-
76
-
77
-
78
-
79
-
80
-
81
-
82
-
83
-
84
-
85
-
86
-
87
-
88
-
89
-
90
-
91
-
92
-
93
-
94
-
95
-
96
-
97
-
98
-
99
-
100
-
101
-
102
-
103
-
104
-
105
-
106
-
107
-
108
 |
 |

SAFEWAY INC. AND SUBSIDIARIES
minimum lease payments and related ancillary costs, net of estimated cost recoveries. In both cases, fair value is
determined by estimating net future cash flows and discounting them using a risk-adjusted rate of interest. The Company
estimates future cash flows based on its experience and knowledge of the market in which the closed store is located
and, when necessary, uses real estate brokers. However, these estimates project future cash flows several years into the
future and are affected by factors such as inflation, real estate markets and economic conditions.
At any one time, Safeway has a portfolio of closed stores which is widely dispersed over several markets. While individual
closed store reserves are likely to be adjusted up or down in the future to reflect changes in assumptions, the change to
the total closed store reserve has not been nor is expected to be material.
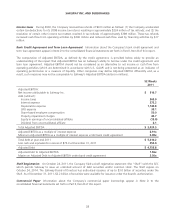
Employee Benefit Plans The Company recognizes in its balance sheet a liability for the underfunded status of its
employee benefit plans. The Company measures plan assets and obligations that determine the funded status as of fiscal
year end. Additional disclosures are provided in Note K to the consolidated financial statements, set forth in Part II, Item 8
of this report.
The determination of Safeway’s obligation and expense for pension benefits is dependent, in part, on the Company’s
selection of certain assumptions used by its actuaries in calculating these amounts. These assumptions are disclosed in
Note K to the consolidated financial statements and include, among other things, the discount rate, the expected long-
term rate of return on plan assets and the rate of compensation increases. Actual results in any given year will often differ
from actuarial assumptions because of economic and other factors. In accordance with generally accepted accounting
principles (“GAAP”), the amount by which actual results differ from the actuarial assumptions is accumulated and
amortized over future periods and, therefore, affects recognized expense in such future periods. While Safeway believes
its assumptions are appropriate, significant differences in actual results or significant changes in the Company’s
assumptions may materially affect Safeway’s pension and other postretirement obligations and its future expense.
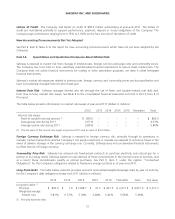
Safeway bases the discount rate on current investment yields on high quality fixed-income investments. The discount rate
assumption used to determine the year-end projected benefit obligation is increased or decreased to be consistent with
the change in yield rates for high-quality fixed-income investments for the expected period to maturity of the pension
benefits. The discount rate used to determine 2011 pension expense was 5.6%. A lower discount rate increases the
present value of benefit obligations and increases pension expense. Expected return on pension plan assets is based on
historical experience of the Company’s portfolio and the review of projected returns by asset class on broad, publicly
traded equity and fixed-income indices, as well as target asset allocation. Safeway’s target asset allocation mix is designed
to meet the Company’s long-term pension requirements. For 2011, the Company’s assumed rate of return was 8.5% on
U.S. pension assets and 6.8% on Canadian pension assets. For 2012, the Company’s assumed rate of return is 7.75% on
U.S pension assets and 6.75% on Canadian pension assets. Over the 10-year period ended December 31, 2011, the
average rate of return was approximately 4% for U.S. and 5% for Canadian pension assets. The deteriorating conditions
in the global financial markets during 2008 led to a substantial reduction in the 10-year average rate of return on pension
assets. We expect that the markets will eventually recover to our assumed long-term rate of return.
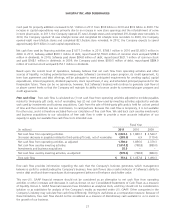
The following table summarizes actual allocations for Safeway’s plans at year-end:
Plan assets
Asset category Target 2011 2010
Equity 65% 65.5% 67.6%
Fixed income 35 33.3 31.1
Cash and other – 1.2 1.3
Total 100% 100.0% 100.0%
The investment policy with regard to Safeway’s pension plans also emphasizes the following key objectives: (1) maintain a
diversified portfolio among asset classes and investment styles; (2) maintain an acceptable level of risk in pursuit of long-
term economic benefit; (3) maximize the opportunity for value-added returns from active investment management while
25