Safeway 2011 Annual Report Download - page 48
Download and view the complete annual report
Please find page 48 of the 2011 Safeway annual report below. You can navigate through the pages in the report by either clicking on the pages listed below, or by using the keyword search tool below to find specific information within the annual report.-
 1
1 -
2
-
3
-
4
-
5
-
6
-
7
-
8
-
9
-
10
-
11
-
12
-
13
-
14
-
15
-
16
-
17
-
18
-
19
-
20
-
21
-
22
-
23
-
24
-
25
-
26
-
27
-
28
-
29
-
30
-
31
-
32
-
33
-
34
-
35
-
36
-
37
-
 38
38 -
 39
39 -
 40
40 -
 41
41 -
 42
42 -
 43
43 -
 44
44 -
 45
45 -
 46
46 -
 47
47 -
 48
48 -
 49
49 -
 50
50 -
 51
51 -
 52
52 -
 53
53 -
 54
54 -
 55
55 -
 56
56 -
 57
57 -
 58
58 -
59
-
60
-
61
-
62
-
63
-
64
-
65
-
66
-
67
-
68
-
69
-
70
-
71
-
72
-
73
-
74
-
75
-
76
-
77
-
78
-
79
-
80
-
81
-
82
-
83
-
84
-
85
-
86
-
87
-
88
-
89
-
90
-
91
-
92
-
93
-
94
-
95
-
96
-
97
-
98
-
99
-
100
-
101
-
102
-
103
-
104
-
105
-
106
-
107
-
108
 |
 |

SAFEWAY INC. AND SUBSIDIARIES
that were executed in fiscal 2011 but were settled in fiscal 2012. The average price per share, excluding commissions,
was $20.85. Taking into consideration stock prices, low interest rates and management’s belief regarding our potential to
grow operating profit over the next several years, Safeway used the net proceeds from borrowings to repurchase
common stock at an increased level during the fourth quarter of 2011. This level of purchases has continued in 2012.
From year-end 2011 through February 22, 2012, Safeway has purchased 28.7 million shares of its common stock at an
average cost of $21.83 per share and a total cost of $626.2 million (including commissions). The timing and volume of
future repurchases will depend on factors such as Safeway’s day-to-day business needs as well as its stock price and
economic and market conditions. Stock repurchases may be affected from time to time through open market purchases
or pursuant to a Rule 10b5-1 plan. The stock repurchase program may be accelerated, suspended, delayed or
discontinued at any time.
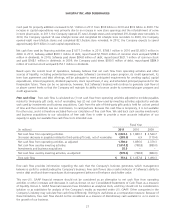
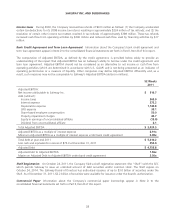
Contractual Obligations The table below presents significant contractual obligations of the Company at year-end
2011 (in millions) (1):
2012 2013 2014 2015 2016 Thereafter Total
Long-term debt (2) $ 806.9 $ 1.6 $ 1,048.7 $ 41.3 $ 401.9 $ 2,671.5 $ 4,971.9
Estimated interest on long-term debt 264.7 218.4 198.3 164.1 164.1 1,034.9 2,044.5
Capital lease obligations (2),(3) 29.2 29.1 29.6 30.9 30.5 284.6 433.9
Interest on capital leases 41.6 38.4 35.5 32.3 29.4 148.0 325.2
Self-insurance liability 129.4 90.3 60.8 39.7 28.7 122.0 470.9
Interest on self-insurance liability 0.5 1.0 1.1 1.1 1.0 10.1 14.8
Operating leases (3) 478.9 452.2 421.5 370.8 328.7 2,219.5 4,271.6
Marketing development funds 29.7 20.7 18.0 12.7 7.0 8.3 96.4
Contracts for purchase of property,
equipment and construction of
buildings 252.6 – – – – – 252.6
Fixed-price energy contracts (4) 85.7 18.4 18.4 16.6 0.7 6.0 145.8
Other purchase obligations 80.3 21.9 7.3 2.5 – – 112.0
Total $ 2,199.5 $ 892.0 $ 1,839.2 $ 712.0 $ 992.0 $ 6,504.9 $ 13,139.6
(1) Excludes funding of pension and post-retirement benefit obligations which were $176.2 million in 2011. The Company currently
expects to contribute approximately $160 million to its pension and post-retirement benefit plans in 2012. Also excludes
contributions under various multiemployer pension plans, which totaled $312.2 million in 2011. Additionally, the amount of
unrecognized tax benefits ($161.3 million at December 31, 2011) has been excluded from the contractual obligations table because
a reasonably reliable estimate of the timing of future tax settlements cannot be determined. Purchase orders for inventory are not
included in the above table as they are cancelable by their terms.
(2) Required principal payments only.
(3) Excludes common area maintenance, insurance or tax payments for which the Company is also obligated. In fiscal 2011, these
charges totaled approximately $217.2 million.
(4) See Part II, Item 7A to this report under the caption “Commodity Price Risk.”
Off-Balance Sheet Arrangements
Guarantees The Company is party to a variety of contractual agreements under which it may be obligated to indemnify
the other party for certain matters. These contracts primarily relate to the Company’s commercial contracts, operating
leases and other real estate contracts, trademarks, intellectual property, financial agreements and various other
agreements. Under these agreements, the Company may provide certain routine indemnifications relating to
representations and warranties (for example, ownership of assets, environmental or tax indemnifications) or personal
injury matters. The terms of these indemnifications range in duration and may not be explicitly defined. The Company
believes that if it were to incur a loss in any of these matters, the loss would not have a material effect on the Company’s
financial statements.
30