Safeway 2013 Annual Report Download - page 180
Download and view the complete annual report
Please find page 180 of the 2013 Safeway annual report below. You can navigate through the pages in the report by either clicking on the pages listed below, or by using the keyword search tool below to find specific information within the annual report.-
 1
1 -
2
-
3
-
4
-
5
-
6
-
7
-
8
-
9
-
10
-
11
-
12
-
13
-
14
-
15
-
16
-
17
-
18
-
19
-
20
-
21
-
22
-
23
-
24
-
25
-
26
-
27
-
28
-
29
-
30
-
31
-
32
-
33
-
34
-
35
-
36
-
37
-
38
-
39
-
40
-
41
-
42
-
43
-
44
-
45
-
46
-
47
-
48
-
49
-
50
-
51
-
52
-
53
-
54
-
55
-
56
-
57
-
58
-
59
-
60
-
61
-
62
-
63
-
64
-
65
-
66
-
67
-
68
-
69
-
70
-
71
-
72
-
73
-
74
-
75
-
76
-
77
-
78
-
79
-
80
-
81
-
82
-
83
-
84
-
85
-
86
-
87
-
88
-
89
-
90
-
91
-
92
-
93
-
94
-
95
-
96
-
97
-
98
-
99
-
100
-
101
-
102
-
103
-
104
-
105
-
106
-
107
-
108
-
109
-
110
-
111
-
112
-
113
-
114
-
115
-
116
-
117
-
118
-
119
-
120
-
121
-
122
-
123
-
124
-
125
-
126
-
127
-
128
-
129
-
130
-
131
-
132
-
133
-
134
-
135
-
136
-
137
-
138
-
139
-
140
-
141
-
142
-
143
-
144
-
145
-
146
-
147
-
148
-
149
-
150
-
151
-
152
-
153
-
154
-
155
-
156
-
157
-
158
-
159
-
160
-
161
-
162
-
163
-
164
-
165
-
166
-
167
-
168
-
169
-
 170
170 -
 171
171 -
 172
172 -
 173
173 -
 174
174 -
 175
175 -
 176
176 -
 177
177 -
 178
178 -
 179
179 -
 180
180 -
 181
181 -
 182
182 -
 183
183 -
 184
184 -
 185
185 -
 186
186 -
 187
187 -
 188
188
 |
 |
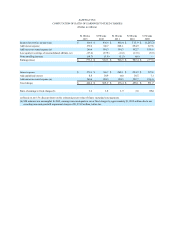
SAFEWAY INC.
COMPUTATION OF RATIO OF EARNINGS TO FIXED CHARGES
(Dollars in millions)
52 Weeks
2013
52 Weeks
2012
52 Weeks
2011
52 Weeks
2010
53 Weeks
2009
Income (loss) before income taxes $336.0 $436.4 $458.4 $515.9 $ (1,293.2)
Add interest expense 273.0 300.7 268.1 294.9 327.8
Add interest on rental expense (a) 200.4 194.3 194.3 192.7 196.6
Less equity in earnings of unconsolidated affiliate, net (17.6) (17.5) (13.0)(15.3) (8.5)
Noncontrolling interests (14.7) (1.6) (1.5) (0.8) —
Earnings (loss) $ 777.1 $ 912.3 $ 906.3 $ 987.4 $ (777.3)
Interest expense $273.0 $300.7 $268.1 $294.9 $327.8
Add capitalized interest 8.8 10.9 14.0 10.5 7.3
Add interest on rental expense (a) 200.4 194.3 194.3 192.7 196.6
Fixed charges $482.2 $505.9 $476.4 $ 498.1 $ 531.7
Ratio of earnings to fixed charges (b) 1.6 1.8 1.9 2.0 NM
(a) Based on an 8.5% discount factor on the estimated present value of future operating lease payments.
(b) NM indicates not meaningful. In 2009, earnings were inadequate to cover fixed charges by approximately $1,309.0 million due to our
recording non-cash goodwill impairment charges of $1,974.2 million, before tax.