Safeway 2013 Annual Report Download - page 44
Download and view the complete annual report
Please find page 44 of the 2013 Safeway annual report below. You can navigate through the pages in the report by either clicking on the pages listed below, or by using the keyword search tool below to find specific information within the annual report.-
 1
1 -
2
-
3
-
4
-
5
-
6
-
7
-
8
-
9
-
10
-
11
-
12
-
13
-
14
-
15
-
16
-
17
-
18
-
19
-
20
-
21
-
22
-
23
-
24
-
25
-
26
-
27
-
28
-
29
-
30
-
31
-
32
-
33
-
 34
34 -
 35
35 -
 36
36 -
 37
37 -
 38
38 -
 39
39 -
 40
40 -
 41
41 -
 42
42 -
 43
43 -
 44
44 -
 45
45 -
 46
46 -
 47
47 -
 48
48 -
 49
49 -
 50
50 -
 51
51 -
 52
52 -
 53
53 -
 54
54 -
55
-
56
-
57
-
58
-
59
-
60
-
61
-
62
-
63
-
64
-
65
-
66
-
67
-
68
-
69
-
70
-
71
-
72
-
73
-
74
-
75
-
76
-
77
-
78
-
79
-
80
-
81
-
82
-
83
-
84
-
85
-
86
-
87
-
88
-
89
-
90
-
91
-
92
-
93
-
94
-
95
-
96
-
97
-
98
-
99
-
100
-
101
-
102
-
103
-
104
-
105
-
106
-
107
-
108
-
109
-
110
-
111
-
112
-
113
-
114
-
115
-
116
-
117
-
118
-
119
-
120
-
121
-
122
-
123
-
124
-
125
-
126
-
127
-
128
-
129
-
130
-
131
-
132
-
133
-
134
-
135
-
136
-
137
-
138
-
139
-
140
-
141
-
142
-
143
-
144
-
145
-
146
-
147
-
148
-
149
-
150
-
151
-
152
-
153
-
154
-
155
-
156
-
157
-
158
-
159
-
160
-
161
-
162
-
163
-
164
-
165
-
166
-
167
-
168
-
169
-
170
-
171
-
172
-
173
-
174
-
175
-
176
-
177
-
178
-
179
-
180
-
181
-
182
-
183
-
184
-
185
-
186
-
187
-
188
 |
 |

Table of Contents
52 Weeks
2012
52 Weeks
2011
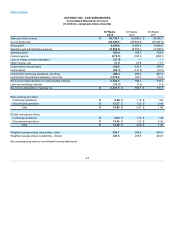
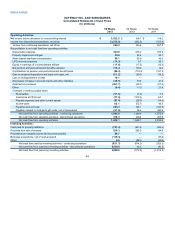
Sales and other revenue $36,068.3 $35,356.7
Cost of goods sold (26,605.9)(25,887.9)
Gross profit 9,462.4 9,468.8
Operating and administrative expense (8,753.1)(8,760.0)
Operating profit 709.3 708.8
Interest expense (300.7)(268.1)
Loss on foreign currency translation — —
Other income, net 27.8 17.7
Income before income taxes 436.4 458.4
Income taxes (141.8)(91.2)
Income from continuing operations, net of tax 294.6 367.2
Income from discontinued operations, net of tax 303.5 151.0
Net income before allocation to noncontrolling interests 598.1 518.2
Less noncontrolling interests (1.6)(1.5)
Net income attributable to Safeway Inc. $596.5 $516.7
Basic earnings per share:
Continuing operations $1.18 $1.06
Discontinued operations $1.23 $0.43
Total $2.41 $1.49
Diluted earnings per share:
Continuing operations $1.18 $1.06
Discontinued operations $1.22 $0.43
Total $2.40 $1.49
Weighted average shares outstanding – basic 245.6 343.4
Weighted average shares outstanding – diluted 245.9 343.8
See accompanying notes to consolidated financial statements.
44