Safeway 2013 Annual Report Download - page 39
Download and view the complete annual report
Please find page 39 of the 2013 Safeway annual report below. You can navigate through the pages in the report by either clicking on the pages listed below, or by using the keyword search tool below to find specific information within the annual report.-
 1
1 -
2
-
3
-
4
-
5
-
6
-
7
-
8
-
9
-
10
-
11
-
12
-
13
-
14
-
15
-
16
-
17
-
18
-
19
-
20
-
21
-
22
-
23
-
24
-
25
-
26
-
27
-
28
-
 29
29 -
 30
30 -
 31
31 -
 32
32 -
 33
33 -
 34
34 -
 35
35 -
 36
36 -
 37
37 -
 38
38 -
 39
39 -
 40
40 -
 41
41 -
 42
42 -
 43
43 -
 44
44 -
 45
45 -
 46
46 -
 47
47 -
 48
48 -
 49
49 -
50
-
51
-
52
-
53
-
54
-
55
-
56
-
57
-
58
-
59
-
60
-
61
-
62
-
63
-
64
-
65
-
66
-
67
-
68
-
69
-
70
-
71
-
72
-
73
-
74
-
75
-
76
-
77
-
78
-
79
-
80
-
81
-
82
-
83
-
84
-
85
-
86
-
87
-
88
-
89
-
90
-
91
-
92
-
93
-
94
-
95
-
96
-
97
-
98
-
99
-
100
-
101
-
102
-
103
-
104
-
105
-
106
-
107
-
108
-
109
-
110
-
111
-
112
-
113
-
114
-
115
-
116
-
117
-
118
-
119
-
120
-
121
-
122
-
123
-
124
-
125
-
126
-
127
-
128
-
129
-
130
-
131
-
132
-
133
-
134
-
135
-
136
-
137
-
138
-
139
-
140
-
141
-
142
-
143
-
144
-
145
-
146
-
147
-
148
-
149
-
150
-
151
-
152
-
153
-
154
-
155
-
156
-
157
-
158
-
159
-
160
-
161
-
162
-
163
-
164
-
165
-
166
-
167
-
168
-
169
-
170
-
171
-
172
-
173
-
174
-
175
-
176
-
177
-
178
-
179
-
180
-
181
-
182
-
183
-
184
-
185
-
186
-
187
-
188
 |
 |

Table of Contents
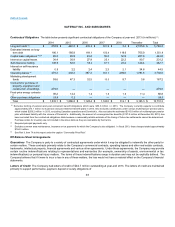
the Company. The Company pays commissions ranging from 0.15% to 1.10% on the face amount of the letters of credit.
See Part II, Item 8, Note A to this report for new accounting pronouncements which have not yet been adopted by the Company.
Safeway is exposed to market risk from changes in interest rates, foreign currency exchange rates and commodity prices. The Company
has, from time to time, selectively used derivative financial instruments to reduce these market risks. The Company does not utilize
financial instruments for trading or other speculative purposes, nor does it utilize leveraged financial instruments.
Safeway’s market risk exposures related to interest rates, foreign currency and commodity prices are discussed below and have not
materially changed from the prior fiscal year.
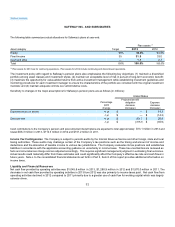
Interest Rate Risk Safeway manages interest rate risk through the use of fixed- and variable-interest rate debt and, from time to time,
interest rate swaps. At year-end 2013, the Company had no interest rate swaps.
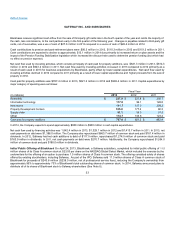
Foreign Currency Exchange Risk Safeway is exposed to foreign currency risk, as approximately $4,032.5 million (CAD4,294.0 million)
of assets and approximately $841.7 million (CAD896.3 million) of liabilities, retained by Safeway after the disposition of CSL in 2013, are
denominated in Canadian dollars. These net assets are exposed to economic losses in the event of adverse changes in the currency
exchange rate. During fiscal 2013, the Company recorded a loss of $57.4 million on currency exchange in continuing operations. As of year-
end 2013, Safeway had no derivative financial instruments to offset the risk of foreign currency.
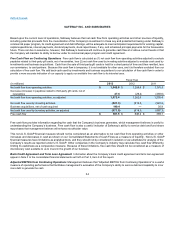
Commodity Price Risk Safeway has entered into fixed-priced contracts to purchase electricity and natural gas for a portion of its energy
needs. Safeway expects to take delivery of these commitments in the normal course of business, and as a result, these commitments
qualify as normal purchases. See Part II, Item 7, under the caption “Contractual Obligations” for the Company’s obligations related to fixed-
price energy contracts as of year-end 2013.
Long-Term Debt The table below presents principal amounts and related weighted-average rates by year of maturity for the Company’s
debt obligations at year-end 2013 (dollars in millions):
2014 2015 2016 2017 2018 Thereafter Total Fair value
Long-term debt: (1)
Principal $252.9 $ 442.2 $ 402.0 $ 501.9 $ 3.4 $ 2,165.8 $ 3,768.2 $ 3,949.7
Weighted average
interest rate 5.63%1.79%3.42%6.35%7.60%5.52%4.98%
(1) Primarily fixed-rate debt.
39