Safeway 2013 Annual Report Download - page 37
Download and view the complete annual report
Please find page 37 of the 2013 Safeway annual report below. You can navigate through the pages in the report by either clicking on the pages listed below, or by using the keyword search tool below to find specific information within the annual report.-
 1
1 -
2
-
3
-
4
-
5
-
6
-
7
-
8
-
9
-
10
-
11
-
12
-
13
-
14
-
15
-
16
-
17
-
18
-
19
-
20
-
21
-
22
-
23
-
24
-
25
-
26
-
 27
27 -
 28
28 -
 29
29 -
 30
30 -
 31
31 -
 32
32 -
 33
33 -
 34
34 -
 35
35 -
 36
36 -
 37
37 -
 38
38 -
 39
39 -
 40
40 -
 41
41 -
 42
42 -
 43
43 -
 44
44 -
 45
45 -
 46
46 -
 47
47 -
48
-
49
-
50
-
51
-
52
-
53
-
54
-
55
-
56
-
57
-
58
-
59
-
60
-
61
-
62
-
63
-
64
-
65
-
66
-
67
-
68
-
69
-
70
-
71
-
72
-
73
-
74
-
75
-
76
-
77
-
78
-
79
-
80
-
81
-
82
-
83
-
84
-
85
-
86
-
87
-
88
-
89
-
90
-
91
-
92
-
93
-
94
-
95
-
96
-
97
-
98
-
99
-
100
-
101
-
102
-
103
-
104
-
105
-
106
-
107
-
108
-
109
-
110
-
111
-
112
-
113
-
114
-
115
-
116
-
117
-
118
-
119
-
120
-
121
-
122
-
123
-
124
-
125
-
126
-
127
-
128
-
129
-
130
-
131
-
132
-
133
-
134
-
135
-
136
-
137
-
138
-
139
-
140
-
141
-
142
-
143
-
144
-
145
-
146
-
147
-
148
-
149
-
150
-
151
-
152
-
153
-
154
-
155
-
156
-
157
-
158
-
159
-
160
-
161
-
162
-
163
-
164
-
165
-
166
-
167
-
168
-
169
-
170
-
171
-
172
-
173
-
174
-
175
-
176
-
177
-
178
-
179
-
180
-
181
-
182
-
183
-
184
-
185
-
186
-
187
-
188
 |
 |
Table of Contents
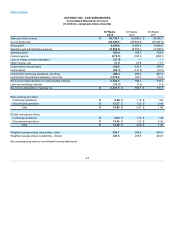
Dividends Paid on Common Stock The following table presents information regarding dividends paid on Safeway’s common stock during
fiscal 2013, 2012 and 2011.
(in millions, except per-share amounts)
Date Paid
Record
Date
Per-Share
Amounts
Total
Year-to-date
Total
2012
Quarter 4
10/11/12
09/20/12
$0.1750
$41.9
$163.9
Quarter 3
07/12/12
06/21/12
0.1750
41.9
122.0
Quarter 2
04/12/12
03/29/12
0.1450
36.3
80.1
Quarter 1
01/12/12
12/22/11
0.1450
43.8
43.8
2011
Quarter 4
10/13/11
09/22/11
$0.1450
$49.3
$188.0
Quarter 3
07/14/11
06/23/11
0.1450
50.7
138.7
Quarter 2
04/14/11
03/24/11
0.1200
43.8
88.0
Quarter 1
01/13/11
12/23/10
0.1200
44.2
44.2
Stock Repurchase Program From the initiation of the Company’s stock repurchase program in 1999 through the end of fiscal 2013, the
aggregate cost of shares of common stock repurchased by the Company, including commissions, was approximately $8.8 billion, leaving an
authorized amount for repurchases of approximately $2.2 billion. During fiscal 2013, Safeway repurchased approximately 19.5 million
shares of its common stock under the repurchase program at an aggregate price, including commissions, of $663.7 million. The average
price per share, excluding commissions, was $33.93. The timing and volume of future repurchases will depend on factors such as
Safeway's day-to-day business needs as well as its stock price and economic and market conditions. Stock repurchases may be affected from
time to time through open market purchases or pursuant to a Rule 10b5-1 plan. The stock repurchase program may be accelerated,
suspended, delayed or discontinued at any time.
37