Safeway 2013 Annual Report Download - page 30
Download and view the complete annual report
Please find page 30 of the 2013 Safeway annual report below. You can navigate through the pages in the report by either clicking on the pages listed below, or by using the keyword search tool below to find specific information within the annual report.-
 1
1 -
2
-
3
-
4
-
5
-
6
-
7
-
8
-
9
-
10
-
11
-
12
-
13
-
14
-
15
-
16
-
17
-
18
-
19
-
 20
20 -
 21
21 -
 22
22 -
 23
23 -
 24
24 -
 25
25 -
 26
26 -
 27
27 -
 28
28 -
 29
29 -
 30
30 -
 31
31 -
 32
32 -
 33
33 -
 34
34 -
 35
35 -
 36
36 -
 37
37 -
 38
38 -
 39
39 -
 40
40 -
41
-
42
-
43
-
44
-
45
-
46
-
47
-
48
-
49
-
50
-
51
-
52
-
53
-
54
-
55
-
56
-
57
-
58
-
59
-
60
-
61
-
62
-
63
-
64
-
65
-
66
-
67
-
68
-
69
-
70
-
71
-
72
-
73
-
74
-
75
-
76
-
77
-
78
-
79
-
80
-
81
-
82
-
83
-
84
-
85
-
86
-
87
-
88
-
89
-
90
-
91
-
92
-
93
-
94
-
95
-
96
-
97
-
98
-
99
-
100
-
101
-
102
-
103
-
104
-
105
-
106
-
107
-
108
-
109
-
110
-
111
-
112
-
113
-
114
-
115
-
116
-
117
-
118
-
119
-
120
-
121
-
122
-
123
-
124
-
125
-
126
-
127
-
128
-
129
-
130
-
131
-
132
-
133
-
134
-
135
-
136
-
137
-
138
-
139
-
140
-
141
-
142
-
143
-
144
-
145
-
146
-
147
-
148
-
149
-
150
-
151
-
152
-
153
-
154
-
155
-
156
-
157
-
158
-
159
-
160
-
161
-
162
-
163
-
164
-
165
-
166
-
167
-
168
-
169
-
170
-
171
-
172
-
173
-
174
-
175
-
176
-
177
-
178
-
179
-
180
-
181
-
182
-
183
-
184
-
185
-
186
-
187
-
188
 |
 |

Table of Contents
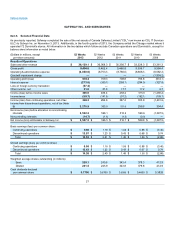
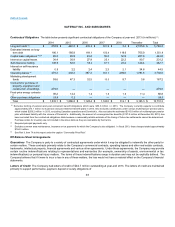
Blackhawk Financial Results Blackhawk revenue (excluding intercompany revenue to Safeway Inc.) was $1,128.5 million for fiscal 2013,
up 19.0% from $948.5 million in fiscal 2012. This increase was primarily due to an increase in the load value of gift cards, an increase in
marketing revenue, an increase in fees from VISA gift cards, increase in sales from Cardpool and an increase in card production sales. In
2013, Blackhawk recorded a gain of $13.5 million from the reduction of contingent consideration related to the acquisition of Cardpool. Also in
2013, Blackhawk incurred a $6.0 million mark-to-market charge for accelerating the expense of a partner equity instrument at the time of its
IPO. Income before taxes from Blackhawk was $84.5 million in 2013 compared to $75.0 million in fiscal 2012.
Blackhawk revenue (excluding intercompany revenue to Safeway Inc.) was $948.5 million for fiscal 2012, up 27.6% from $743.3 million in
fiscal 2011. This increase was primarily due to an increase in the load value of gift cards, an increase in marketing revenue, an increase in
sales from Cardpool and an increase in telecom handset sales. Income before taxes from Blackhawk was $75.0 million in 2012 compared to
$60.7 million in fiscal 2011.
Critical accounting policies are those accounting policies that management believes are important to the portrayal of Safeway’s financial
condition and results of operations and require management’s most difficult, subjective or complex judgments, often as a result of the need
to make estimates about the effect of matters that are inherently uncertain.
Workers’ Compensation The Company is primarily self-insured for workers’ compensation, automobile and general liability costs. It is the
Company’s policy to record its self-insurance liability as determined actuarially, based on claims filed and an estimate of claims incurred but
not yet reported.
Self-insurance reserves are actuarially determined primarily by applying historical paid loss and incurred loss development trends to current
cash and incurred expected losses in order to estimate total losses. The Company then discounts total expected losses to their present value
using a risk-free rate of return.
Any actuarial projection of self-insured losses is subject to a high degree of variability. Litigation trends, legal interpretations, benefit level
changes, claim settlement patterns and similar factors influenced historical development trends that were used to determine the current-year
expense and therefore contributed to the variability in annual expense. However, these factors are not direct inputs into the actuarial
projection, and thus their individual impact cannot be quantified.
The discount rate is a significant factor that has led to variability in self-insured expenses. Since the discount rate is a direct input into the
estimation process, the Company is able to quantify its impact. The discount rate, which is based on the United States Treasury Note rates
for the estimated average claim life of five years, was 1.75% in 2013, 0.75% in 2012 and 0.75% in 2011. A 25-basis-point change in the
discount rate affects the self-insured liability by approximately $6 million.
The majority of the Company’s workers’ compensation liability is from claims occurring in California. California workers’ compensation has
received intense scrutiny from the state’s politicians, insurers, employers and providers, as well as the public in general. Recent years have
seen escalation in the number of legislative reforms, judicial rulings and social phenomena affecting this business. Some of the many
sources of uncertainty in the Company’s reserve estimates include changes in benefit levels, medical fee schedules, medical utilization
guidelines, vocation rehabilitation and apportionment.
Store Lease Exit Costs and Impairment Charges Safeway assesses store impairment indicators quarterly. Safeway’s policy is to
recognize losses relating to the impairment of long-lived assets when
30