Safeway 2013 Annual Report Download - page 73
Download and view the complete annual report
Please find page 73 of the 2013 Safeway annual report below. You can navigate through the pages in the report by either clicking on the pages listed below, or by using the keyword search tool below to find specific information within the annual report.-
 1
1 -
2
-
3
-
4
-
5
-
6
-
7
-
8
-
9
-
10
-
11
-
12
-
13
-
14
-
15
-
16
-
17
-
18
-
19
-
20
-
21
-
22
-
23
-
24
-
25
-
26
-
27
-
28
-
29
-
30
-
31
-
32
-
33
-
34
-
35
-
36
-
37
-
38
-
39
-
40
-
41
-
42
-
43
-
44
-
45
-
46
-
47
-
48
-
49
-
50
-
51
-
52
-
53
-
54
-
55
-
56
-
57
-
58
-
59
-
60
-
61
-
62
-
 63
63 -
 64
64 -
 65
65 -
 66
66 -
 67
67 -
 68
68 -
 69
69 -
 70
70 -
 71
71 -
 72
72 -
 73
73 -
 74
74 -
 75
75 -
 76
76 -
 77
77 -
 78
78 -
 79
79 -
 80
80 -
 81
81 -
 82
82 -
 83
83 -
84
-
85
-
86
-
87
-
88
-
89
-
90
-
91
-
92
-
93
-
94
-
95
-
96
-
97
-
98
-
99
-
100
-
101
-
102
-
103
-
104
-
105
-
106
-
107
-
108
-
109
-
110
-
111
-
112
-
113
-
114
-
115
-
116
-
117
-
118
-
119
-
120
-
121
-
122
-
123
-
124
-
125
-
126
-
127
-
128
-
129
-
130
-
131
-
132
-
133
-
134
-
135
-
136
-
137
-
138
-
139
-
140
-
141
-
142
-
143
-
144
-
145
-
146
-
147
-
148
-
149
-
150
-
151
-
152
-
153
-
154
-
155
-
156
-
157
-
158
-
159
-
160
-
161
-
162
-
163
-
164
-
165
-
166
-
167
-
168
-
169
-
170
-
171
-
172
-
173
-
174
-
175
-
176
-
177
-
178
-
179
-
180
-
181
-
182
-
183
-
184
-
185
-
186
-
187
-
188
 |
 |

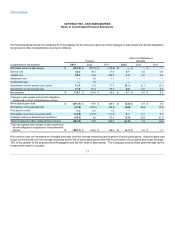
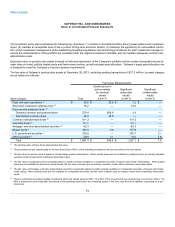
Unvested, beginning of year 2,412,830
$22.16
Granted 747,708
23.43
Vested (672,657)
22.31
Canceled (255,618)
23.01
Unvested, end of year 2,232,263
$22.45
At the date of vest, the fair value of restricted stock awards vested during the year was $16.4 million in 2013, $14.2 million in 2012 and $6.6
million in 2011. At December 28, 2013, there was $36.2 million of total unrecognized compensation cost related to non-vested restricted
stock awards. The cost is expected to be recognized over a weighted average period of 2.7 years.
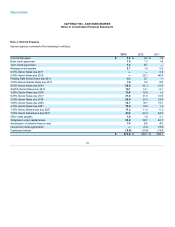
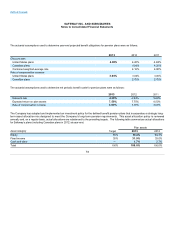
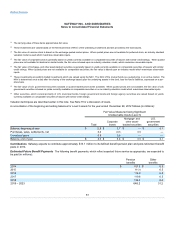
Total share-based compensation expenses for continuing operations recognized as a component of operating and administrative expense is
as follows (in millions):
2012 2011
Share-based compensation expense $53.6 $48.5
Income tax benefit (20.8)(18.8)
Share-based compensation expense recognized in
earnings, net of tax $32.8 $29.7
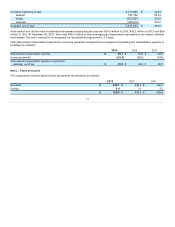
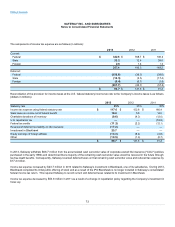
The components of income before income tax expense are as follows (in millions):
2012 2011
Domestic $434.3 $456.1
Foreign 2.1 2.3
$436.4 $458.4
71