Safeway 2013 Annual Report Download - page 54
Download and view the complete annual report
Please find page 54 of the 2013 Safeway annual report below. You can navigate through the pages in the report by either clicking on the pages listed below, or by using the keyword search tool below to find specific information within the annual report.-
 1
1 -
2
-
3
-
4
-
5
-
6
-
7
-
8
-
9
-
10
-
11
-
12
-
13
-
14
-
15
-
16
-
17
-
18
-
19
-
20
-
21
-
22
-
23
-
24
-
25
-
26
-
27
-
28
-
29
-
30
-
31
-
32
-
33
-
34
-
35
-
36
-
37
-
38
-
39
-
40
-
41
-
42
-
43
-
 44
44 -
 45
45 -
 46
46 -
 47
47 -
 48
48 -
 49
49 -
 50
50 -
 51
51 -
 52
52 -
 53
53 -
 54
54 -
 55
55 -
 56
56 -
 57
57 -
 58
58 -
 59
59 -
 60
60 -
 61
61 -
 62
62 -
 63
63 -
 64
64 -
65
-
66
-
67
-
68
-
69
-
70
-
71
-
72
-
73
-
74
-
75
-
76
-
77
-
78
-
79
-
80
-
81
-
82
-
83
-
84
-
85
-
86
-
87
-
88
-
89
-
90
-
91
-
92
-
93
-
94
-
95
-
96
-
97
-
98
-
99
-
100
-
101
-
102
-
103
-
104
-
105
-
106
-
107
-
108
-
109
-
110
-
111
-
112
-
113
-
114
-
115
-
116
-
117
-
118
-
119
-
120
-
121
-
122
-
123
-
124
-
125
-
126
-
127
-
128
-
129
-
130
-
131
-
132
-
133
-
134
-
135
-
136
-
137
-
138
-
139
-
140
-
141
-
142
-
143
-
144
-
145
-
146
-
147
-
148
-
149
-
150
-
151
-
152
-
153
-
154
-
155
-
156
-
157
-
158
-
159
-
160
-
161
-
162
-
163
-
164
-
165
-
166
-
167
-
168
-
169
-
170
-
171
-
172
-
173
-
174
-
175
-
176
-
177
-
178
-
179
-
180
-
181
-
182
-
183
-
184
-
185
-
186
-
187
-
188
 |
 |

Table of Contents
are also included as a component of cost of goods sold. Such costs are expensed in the period the advertisement occurs. Advertising and
promotional expenses totaled $372.6 million in 2013, $416.7 million in 2012 and $408.6 million in 2011.
Cash and Equivalents Cash and equivalents include short-term investments with original maturities of less than three months and credit
and debit card sales transactions which settle within a few business days of year end.
Book overdrafts at year-end 2013 and 2012 of $84.5 million and $25.8 million, respectively, are included in accounts payable.
Receivables Receivables include pharmacy, gift card receivables and miscellaneous trade receivables.
Merchandise Inventories Merchandise inventory of $1,643.2 million at year-end 2013 and $1,608.4 million at year-end 2012 is valued at
the lower of cost on a last-in, first-out (“LIFO”) basis or market value. Such LIFO inventory had a replacement or current cost of $1,701.3
million at year-end 2013 and $1,678.9 million at year-end 2012. Liquidations of LIFO layers during the three years reported did not have a
material effect on the results of operations. The remaining inventory consists primarily of perishables, pharmacy and fuel inventory.
Perishables are counted every four weeks and are carried at the last purchased cost or the last four-week average cost, which approximates
first-in, first out ("FIFO") cost. Pharmacy and fuel inventories are carried at the last purchased cost, which approximates FIFO cost. The
Company records an inventory shrink adjustment upon physical counts and also provides for estimated inventory shrink adjustments for the
period between the last physical inventory and each balance sheet date.
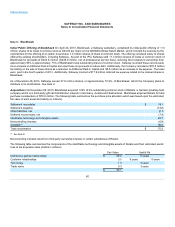
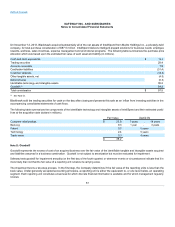
Property and Depreciation Property is stated at cost. Depreciation expense on buildings and equipment is computed on the straight-line
method using the following lives:
Stores and other buildings 7 to 40 years
Fixtures and equipment 3 to 15 years
Safeway capitalizes eligible costs to acquire or develop internal-use software that are incurred during the application development stage as
part of fixtures and equipment. Capitalized costs related to internal-use software are amortized using the straight-line method over the
estimated useful lives of the assets.
Property under capital leases and leasehold improvements is amortized on a straight-line basis over the shorter of the remaining terms of the
leases or the estimated useful lives of the assets.
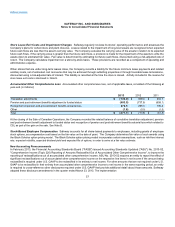
Company-Owned Life Insurance Policies Safeway has company-owned life insurance policies that have a cash surrender value. During
2013, Safeway borrowed against these policies. The Company has no current intention of repaying the loans prior to maturity or cancellation
of the policies. Therefore, we offset the cash surrender value by the related loans. At December 28, 2013, the cash surrender value of the
policies was $58.5 million, and the balance of the policy loans was $40.9 million, resulting in a net cash surrender value of $17.6 million. At
December 29, 2012, the cash surrender value of the policies was $89.0 million, and no policy loans were outstanding.
Employee Benefit Plans The Company recognizes in its statement of financial position an asset for its employee benefit plan's overfunded
status or a liability for underfunded status. The Company measures plan assets and obligations that determine the funded status as of fiscal
year end. See Note M.
Self-Insurance The Company is primarily self-insured for workers’ compensation, automobile and general liability costs. The self-
insurance liability is determined actuarially, based on claims filed and an estimate of
54