Safeway 2013 Annual Report Download - page 21
Download and view the complete annual report
Please find page 21 of the 2013 Safeway annual report below. You can navigate through the pages in the report by either clicking on the pages listed below, or by using the keyword search tool below to find specific information within the annual report.-
 1
1 -
2
-
3
-
4
-
5
-
6
-
7
-
8
-
9
-
10
-
 11
11 -
 12
12 -
 13
13 -
 14
14 -
 15
15 -
 16
16 -
 17
17 -
 18
18 -
 19
19 -
 20
20 -
 21
21 -
 22
22 -
 23
23 -
 24
24 -
 25
25 -
 26
26 -
 27
27 -
 28
28 -
 29
29 -
 30
30 -
 31
31 -
32
-
33
-
34
-
35
-
36
-
37
-
38
-
39
-
40
-
41
-
42
-
43
-
44
-
45
-
46
-
47
-
48
-
49
-
50
-
51
-
52
-
53
-
54
-
55
-
56
-
57
-
58
-
59
-
60
-
61
-
62
-
63
-
64
-
65
-
66
-
67
-
68
-
69
-
70
-
71
-
72
-
73
-
74
-
75
-
76
-
77
-
78
-
79
-
80
-
81
-
82
-
83
-
84
-
85
-
86
-
87
-
88
-
89
-
90
-
91
-
92
-
93
-
94
-
95
-
96
-
97
-
98
-
99
-
100
-
101
-
102
-
103
-
104
-
105
-
106
-
107
-
108
-
109
-
110
-
111
-
112
-
113
-
114
-
115
-
116
-
117
-
118
-
119
-
120
-
121
-
122
-
123
-
124
-
125
-
126
-
127
-
128
-
129
-
130
-
131
-
132
-
133
-
134
-
135
-
136
-
137
-
138
-
139
-
140
-
141
-
142
-
143
-
144
-
145
-
146
-
147
-
148
-
149
-
150
-
151
-
152
-
153
-
154
-
155
-
156
-
157
-
158
-
159
-
160
-
161
-
162
-
163
-
164
-
165
-
166
-
167
-
168
-
169
-
170
-
171
-
172
-
173
-
174
-
175
-
176
-
177
-
178
-
179
-
180
-
181
-
182
-
183
-
184
-
185
-
186
-
187
-
188
 |
 |
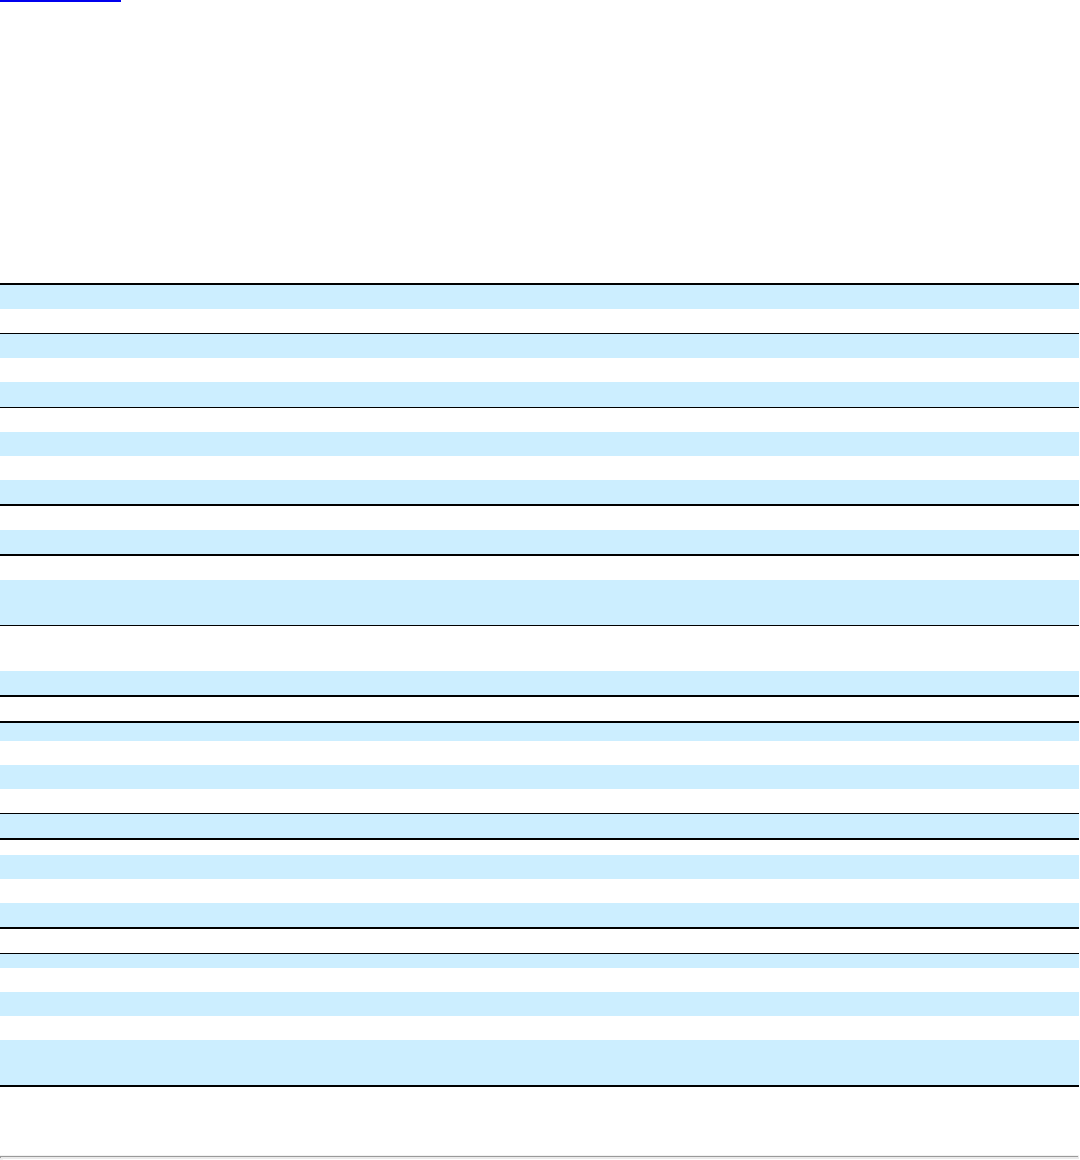
Table of Contents
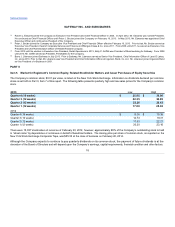
As previously reported, Safeway completed the sale of the net assets of Canada Safeway Limited ("CSL" now known as CSL IT Services
ULC) to Sobeys Inc. on November 3, 2013. Additionally, in the fourth quarter of 2013, the Company exited the Chicago market where it
operated 72 Dominick's stores. All information in the two tables which follow exclude Canadian operations and Dominick's, except for
balance sheet information as noted below.
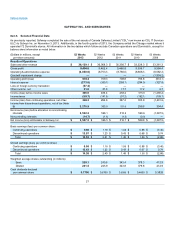
(Dollars in millions, except
per-share amounts)
52 Weeks
2012
52 Weeks
2011
52 Weeks
2010
53 Weeks
2009
Sales and other revenue $36,068.3 $35,356.7 $33,228.3 $33,361.3
Gross profit 9,462.4 9,468.8 9,399.7 9,564.4
Operating & administrative expense (8,753.1)(8,760.0)(8,606.1)(8,562.3)
Goodwill impairment charge — — — (1,974.2)
Operating profit (loss) 709.3 708.8 793.6 (972.1)
Interest expense (300.7)(268.1)(294.9)(327.8)
Loss on foreign currency translation — — — —
Other income, net 27.8 17.7 17.2 6.7
Income (loss) before income taxes 436.4 458.4 515.9 (1,293.2)
Income taxes (141.8)(91.2)(182.1)(108.7)
Income (loss) from continuing operations, net of tax 294.6 367.2 333.8 (1,401.9)
Income from discontinued operations, net of tax (Note
B) 303.5 151.0 256.8 304.4
Net income (loss) before allocation to noncontrolling
interests 598.1 518.2 590.6 (1,097.5)
Noncontrolling interests (1.6)(1.5)(0.8)—
Net income (loss) attributable to Safeway Inc. $596.5 $516.7 $589.8 $(1,097.5)
Basic earnings (loss) per common share:
Continuing operations $1.18 $1.06 $0.88 $(3.40)
Discontinued operations $1.23 $0.43 $0.68 $0.74
Total $2.41 $1.49 $1.56 $(2.66)
Diluted earnings (loss) per common share:
Continuing operations $1.18 $1.06 $0.88 $(3.40)
Discontinued operations $1.22 $0.43 $0.67 $0.74
Total $2.40 $1.49 $1.55 $(2.66)
Weighted average shares outstanding (in millions):
Basic 245.6 343.4 378.3 412.9
Diluted 245.9 343.8 379.6 412.9
Cash dividends declared
per common share $0.6700 $0.5550 $0.4600 $0.3828
21