Safeway 2013 Annual Report Download - page 22
Download and view the complete annual report
Please find page 22 of the 2013 Safeway annual report below. You can navigate through the pages in the report by either clicking on the pages listed below, or by using the keyword search tool below to find specific information within the annual report.-
 1
1 -
2
-
3
-
4
-
5
-
6
-
7
-
8
-
9
-
10
-
11
-
 12
12 -
 13
13 -
 14
14 -
 15
15 -
 16
16 -
 17
17 -
 18
18 -
 19
19 -
 20
20 -
 21
21 -
 22
22 -
 23
23 -
 24
24 -
 25
25 -
 26
26 -
 27
27 -
 28
28 -
 29
29 -
 30
30 -
 31
31 -
 32
32 -
33
-
34
-
35
-
36
-
37
-
38
-
39
-
40
-
41
-
42
-
43
-
44
-
45
-
46
-
47
-
48
-
49
-
50
-
51
-
52
-
53
-
54
-
55
-
56
-
57
-
58
-
59
-
60
-
61
-
62
-
63
-
64
-
65
-
66
-
67
-
68
-
69
-
70
-
71
-
72
-
73
-
74
-
75
-
76
-
77
-
78
-
79
-
80
-
81
-
82
-
83
-
84
-
85
-
86
-
87
-
88
-
89
-
90
-
91
-
92
-
93
-
94
-
95
-
96
-
97
-
98
-
99
-
100
-
101
-
102
-
103
-
104
-
105
-
106
-
107
-
108
-
109
-
110
-
111
-
112
-
113
-
114
-
115
-
116
-
117
-
118
-
119
-
120
-
121
-
122
-
123
-
124
-
125
-
126
-
127
-
128
-
129
-
130
-
131
-
132
-
133
-
134
-
135
-
136
-
137
-
138
-
139
-
140
-
141
-
142
-
143
-
144
-
145
-
146
-
147
-
148
-
149
-
150
-
151
-
152
-
153
-
154
-
155
-
156
-
157
-
158
-
159
-
160
-
161
-
162
-
163
-
164
-
165
-
166
-
167
-
168
-
169
-
170
-
171
-
172
-
173
-
174
-
175
-
176
-
177
-
178
-
179
-
180
-
181
-
182
-
183
-
184
-
185
-
186
-
187
-
188
 |
 |

Table of Contents
(Dollars in millions, except
per-share amounts)
52 Weeks
2012
52 Weeks
2011
52 Weeks
2010
53 Weeks
2009
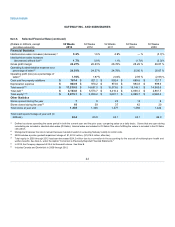
Identical-store sales increases (decreases) (1) 1.6%4.9% — % (5.7)%
Identical-store sales increases
(decreases) without fuel(1) 0.8%1.1%(1.7)% (3.0)%
Gross profit margin 26.23%26.78%28.29 % 28.67 %
Operating & administrative expense as a
percentage of sales(2) 24.27%24.78%25.90 % 25.67 %
Operating profit (loss) as a percentage of
sales(3) 1.97%2.00%2.39 % (2.91)%
Cash paid for property additions $821.2 $992.4 $689.6 $721.7
Depreciation expense $970.2 $973.0 $984.8 $999.3
Total assets(3,6) $14,657.0 $15,073.6 $15,148.1 $14,963.6
Total debt (6) $5,573.7 $5,410.2 $4,836.3 $4,901.7
Total equity(3,4,6) $2,909.2 $3,691.1 $4,999.7 $4,948.4
Stores opened during the year 822 12 6
Stores closed during the year(5) 39 37 42 20
Total stores at year end 1,346 1,377 1,392 1,422
Total retail square footage at year end (in
millions) 63.8 65.1 65.1 66.0
(1) Defined as stores operating the same period in both the current year and the prior year, comparing sales on a daily basis. Stores that are open during
remodeling are included in identical-store sales (ID Sales). Internet sales are included in ID Sales if the store fulfilling the orders is included in the ID Sales
calculation.
(2) Management believes this ratio is relevant because it assists investors in evaluating Safeway’s ability to control costs.
(3) 2009 includes a pretax goodwill impairment charge of $1,974.2 million, ($1,818.2 million, after-tax).
(4) Total equity in 2009 through 2012 has been decreased $24.2 million due to a correction in the accounting for the accrual of multiemployer health and
welfare benefits. See Note A, under the caption "Correction to Previously Reported Financial Statements."
(5) In 2012, the Company disposed of 25 of its Genuardi's stores. See Note B.
(6) Includes Canada and Dominick's in 2009 through 2012.
22