Safeway 2013 Annual Report Download - page 72
Download and view the complete annual report
Please find page 72 of the 2013 Safeway annual report below. You can navigate through the pages in the report by either clicking on the pages listed below, or by using the keyword search tool below to find specific information within the annual report.-
 1
1 -
2
-
3
-
4
-
5
-
6
-
7
-
8
-
9
-
10
-
11
-
12
-
13
-
14
-
15
-
16
-
17
-
18
-
19
-
20
-
21
-
22
-
23
-
24
-
25
-
26
-
27
-
28
-
29
-
30
-
31
-
32
-
33
-
34
-
35
-
36
-
37
-
38
-
39
-
40
-
41
-
42
-
43
-
44
-
45
-
46
-
47
-
48
-
49
-
50
-
51
-
52
-
53
-
54
-
55
-
56
-
57
-
58
-
59
-
60
-
61
-
 62
62 -
 63
63 -
 64
64 -
 65
65 -
 66
66 -
 67
67 -
 68
68 -
 69
69 -
 70
70 -
 71
71 -
 72
72 -
 73
73 -
 74
74 -
 75
75 -
 76
76 -
 77
77 -
 78
78 -
 79
79 -
 80
80 -
 81
81 -
 82
82 -
83
-
84
-
85
-
86
-
87
-
88
-
89
-
90
-
91
-
92
-
93
-
94
-
95
-
96
-
97
-
98
-
99
-
100
-
101
-
102
-
103
-
104
-
105
-
106
-
107
-
108
-
109
-
110
-
111
-
112
-
113
-
114
-
115
-
116
-
117
-
118
-
119
-
120
-
121
-
122
-
123
-
124
-
125
-
126
-
127
-
128
-
129
-
130
-
131
-
132
-
133
-
134
-
135
-
136
-
137
-
138
-
139
-
140
-
141
-
142
-
143
-
144
-
145
-
146
-
147
-
148
-
149
-
150
-
151
-
152
-
153
-
154
-
155
-
156
-
157
-
158
-
159
-
160
-
161
-
162
-
163
-
164
-
165
-
166
-
167
-
168
-
169
-
170
-
171
-
172
-
173
-
174
-
175
-
176
-
177
-
178
-
179
-
180
-
181
-
182
-
183
-
184
-
185
-
186
-
187
-
188
 |
 |

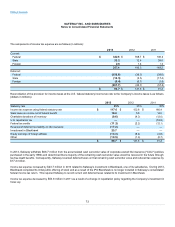
Restricted Stock The Company awarded 747,708 shares, 695,816 shares and 1,470,625 shares of restricted stock in 2013, 2012 and
2011, respectively, to certain officers and key employees. These shares vest over a period of between three to five years and are subject to
certain transfer restrictions and forfeiture prior to vesting. Deferred stock compensation, representing the fair value of the stock at the
measurement date of the award, is amortized to compensation expense over the vesting period. The amortization of restricted stock resulted
in compensation expense for continuing operations of $15.8 million in 2013, $13.1 million in 2012 and $10.5 million in 2011.
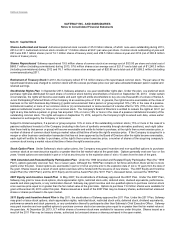
Performance Share Awards In 2013 and 2012, Safeway granted performance share awards to certain executives. These performance
share awards, covering a target of approximately 1.2 million shares in 2013 and 1.1 million shares in 2012, will vest over three years and
are subject to the achievement of earnings per share goals determined on a compound annual growth rate basis relative to the S&P 500. If
these goals are achieved above a certain level and Safeway meets certain Total Shareholder Return criteria, certain executives may receive
additional shares of stock above the target number of performance shares, subject to a specified maximum. Likewise, executives may earn
less than the target number of performance shares. The Company recorded $14.9 million in expense in 2013 and $9.8 million in expense in
2012 related to these awards based on the expected achievement of the performance target. The payouts related to all active awards, if
earned, will be settled in the Company’s common stock after the end of each performance period.
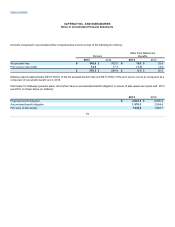
Activity in the Company’s stock option plans for the year ended December 28, 2013 was as follows:
Options
Weighted-
average
exercise price
Aggregate
intrinsic
value
(in millions)
Outstanding, beginning of year 24,097,393
$25.92
$0.9
(1) The remaining weighted-average contractual life of these options is 4.7 years.
(2) The remaining weighted-average contractual life of these options is 6.1 years.
Weighted-average fair value of options granted during the year:
2011 $5.87
2012 4.50
The total intrinsic value of options exercised was $47.0 million in 2013, $0.7 million in 2012 and $9.7 million in 2011. As of year-end 2013,
there was $57.8 million of total unrecognized compensation cost related to nonvested stock-based compensation arrangements granted
under the Company’s stock option plans. That cost is expected to be recognized over a weighted-average period of 2.6 years.
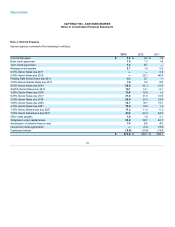
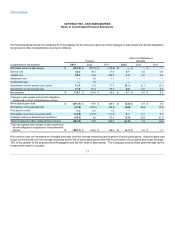
Additional Stock Plan Information Safeway accounts for stock-based employee compensation in accordance with generally accepted
accounting principles for stock compensation. The Company determines fair value of such awards using the Black-Scholes option pricing
model. The following weighted-average assumptions used, by year, to value Safeway’s grants are as follows:
2012 2011
Expected life (in years) 6.25 –6.5
6.5
Expected stock volatility 30.6% – 33.9%29.8% – 34.1%
Risk-free interest rate 0.9% – 1.3%1.5% – 2.7%
Expected dividend yield during the expected
term 2.8% – 3.7%2.2% – 2.7%
The expected term of the awards was determined utilizing the “simplified method” outlined in SEC Staff Accounting Bulletin No. 107 that
utilizes the following formula: (vesting term + original contract term)/2. Expected stock volatility was determined based upon a combination
of historical volatility for periods preceding the measurement date and estimates of implied volatility based upon open interests in traded
option contracts on Safeway common stock. The risk-free interest rate was based on the yield curve in effect at the time the options were
granted, using U.S. constant maturities over the expected life of the option. Expected dividend yield is based on Safeway’s dividend policy at
the time the options were granted.
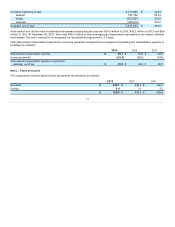
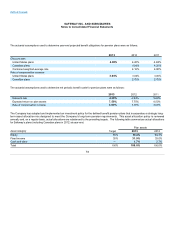
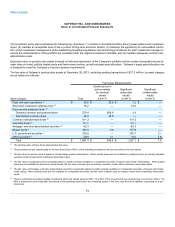
The following table summarizes information about unvested Safeway restricted stock as of December 28, 2013:
Awards
Weighted-
average
grant
date
fair value