Safeway 2013 Annual Report Download - page 83
Download and view the complete annual report
Please find page 83 of the 2013 Safeway annual report below. You can navigate through the pages in the report by either clicking on the pages listed below, or by using the keyword search tool below to find specific information within the annual report.-
 1
1 -
2
-
3
-
4
-
5
-
6
-
7
-
8
-
9
-
10
-
11
-
12
-
13
-
14
-
15
-
16
-
17
-
18
-
19
-
20
-
21
-
22
-
23
-
24
-
25
-
26
-
27
-
28
-
29
-
30
-
31
-
32
-
33
-
34
-
35
-
36
-
37
-
38
-
39
-
40
-
41
-
42
-
43
-
44
-
45
-
46
-
47
-
48
-
49
-
50
-
51
-
52
-
53
-
54
-
55
-
56
-
57
-
58
-
59
-
60
-
61
-
62
-
63
-
64
-
65
-
66
-
67
-
68
-
69
-
70
-
71
-
72
-
 73
73 -
 74
74 -
 75
75 -
 76
76 -
 77
77 -
 78
78 -
 79
79 -
 80
80 -
 81
81 -
 82
82 -
 83
83 -
 84
84 -
 85
85 -
 86
86 -
 87
87 -
 88
88 -
 89
89 -
 90
90 -
 91
91 -
 92
92 -
 93
93 -
94
-
95
-
96
-
97
-
98
-
99
-
100
-
101
-
102
-
103
-
104
-
105
-
106
-
107
-
108
-
109
-
110
-
111
-
112
-
113
-
114
-
115
-
116
-
117
-
118
-
119
-
120
-
121
-
122
-
123
-
124
-
125
-
126
-
127
-
128
-
129
-
130
-
131
-
132
-
133
-
134
-
135
-
136
-
137
-
138
-
139
-
140
-
141
-
142
-
143
-
144
-
145
-
146
-
147
-
148
-
149
-
150
-
151
-
152
-
153
-
154
-
155
-
156
-
157
-
158
-
159
-
160
-
161
-
162
-
163
-
164
-
165
-
166
-
167
-
168
-
169
-
170
-
171
-
172
-
173
-
174
-
175
-
176
-
177
-
178
-
179
-
180
-
181
-
182
-
183
-
184
-
185
-
186
-
187
-
188
 |
 |

Table of Contents
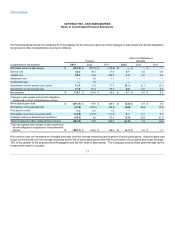
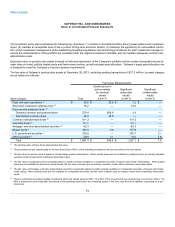
(1) The carrying value of these items approximates fair value.
(2) These investments are valued based on the Net Asset Value (“NAV”) of the underlying investments and are provided by the fund issuers.
(3) The fair value of common stock is based on the exchange quoted market prices. When quoted prices are not available for preferred stock, an industry standard
valuation model is used which maximizes observable inputs.
(4) The fair value of corporate bonds is generally based on yields currently available on comparable securities of issuers with similar credit ratings. When quoted
prices are not available for identical or similar bonds, the fair value is based upon an industry valuation model, which maximizes observable inputs.
(5) The fair value of mortgage- and other asset-backed securities is generally based on yields currently available on comparable securities of issuers with similar
credit ratings. When quoted prices are not available for comparable securities, the fair value is based upon an industry model which maximizes observable
inputs.
(6) These investments are publicly traded investments which are valued using the NAV. The NAV of the mutual funds is a quoted price in an active market. The
NAV is determined once a day after the closing of the exchange based upon the underlying assets in the fund, less the fund’s liabilities, expressed on a per-
share basis.
(7) The fair value of U.S. government securities is based on quoted market prices when available. When quoted prices are not available, the fair value of U.S.
government securities is based on yields currently available on comparable securities or on an industry valuation model which maximizes observable inputs.
(8) Other securities, which consist primarily of U.S. municipal bonds, foreign government bonds and foreign agency securities are valued based on yields
currently available on comparable securities of issuers with similar credit ratings.
Valuation techniques are described earlier in this note. See Note H for a discussion of levels.
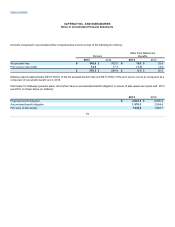
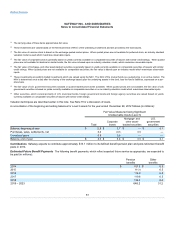
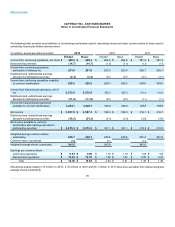
A reconciliation of the beginning and ending balances for Level 3 assets for the year ended December 29, 2012 follows (in millions):
Fair Value Measured Using Significant
Unobservable Inputs (Level 3)
Total
Corporate
bonds
Mortgage- and
other asset-
backed securities
U.S.
government
securities
Balance, beginning of year $2.8 $2.7 $ — $ 0.1
Purchases, sales, settlements, net 0.4 (0.1)0.5 —
Unrealized gains 0.8 0.8 — —
Balance, end of year $4.0 $3.4 $0.5 $0.1
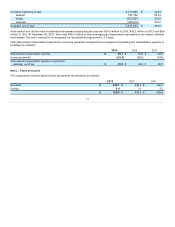
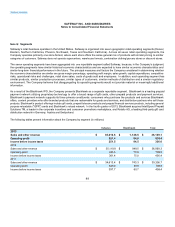
Contributions Safeway expects to contribute approximately $13.1 million to its defined benefit pension plan and post-retirement benefit
plans in 2014.
Estimated Future Benefit Payments The following benefit payments, which reflect expected future service as appropriate, are expected to
be paid (in millions):
Pension
benefits
Other
benefits
2014 $107.3 $6.5
2015 111.4 6.5
2016 114.9 6.5
2017 119.6 6.5
2018 122.0 6.4
2019 – 2023 648.2 31.2
81