Safeway 2013 Annual Report Download - page 92
Download and view the complete annual report
Please find page 92 of the 2013 Safeway annual report below. You can navigate through the pages in the report by either clicking on the pages listed below, or by using the keyword search tool below to find specific information within the annual report.-
 1
1 -
2
-
3
-
4
-
5
-
6
-
7
-
8
-
9
-
10
-
11
-
12
-
13
-
14
-
15
-
16
-
17
-
18
-
19
-
20
-
21
-
22
-
23
-
24
-
25
-
26
-
27
-
28
-
29
-
30
-
31
-
32
-
33
-
34
-
35
-
36
-
37
-
38
-
39
-
40
-
41
-
42
-
43
-
44
-
45
-
46
-
47
-
48
-
49
-
50
-
51
-
52
-
53
-
54
-
55
-
56
-
57
-
58
-
59
-
60
-
61
-
62
-
63
-
64
-
65
-
66
-
67
-
68
-
69
-
70
-
71
-
72
-
73
-
74
-
75
-
76
-
77
-
78
-
79
-
80
-
81
-
 82
82 -
 83
83 -
 84
84 -
 85
85 -
 86
86 -
 87
87 -
 88
88 -
 89
89 -
 90
90 -
 91
91 -
 92
92 -
 93
93 -
 94
94 -
 95
95 -
 96
96 -
 97
97 -
 98
98 -
 99
99 -
 100
100 -
 101
101 -
 102
102 -
103
-
104
-
105
-
106
-
107
-
108
-
109
-
110
-
111
-
112
-
113
-
114
-
115
-
116
-
117
-
118
-
119
-
120
-
121
-
122
-
123
-
124
-
125
-
126
-
127
-
128
-
129
-
130
-
131
-
132
-
133
-
134
-
135
-
136
-
137
-
138
-
139
-
140
-
141
-
142
-
143
-
144
-
145
-
146
-
147
-
148
-
149
-
150
-
151
-
152
-
153
-
154
-
155
-
156
-
157
-
158
-
159
-
160
-
161
-
162
-
163
-
164
-
165
-
166
-
167
-
168
-
169
-
170
-
171
-
172
-
173
-
174
-
175
-
176
-
177
-
178
-
179
-
180
-
181
-
182
-
183
-
184
-
185
-
186
-
187
-
188
 |
 |

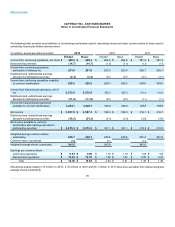
Table of Contents
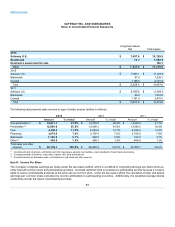
The following table provides reconciliations of net earnings and shares used in calculating income per basic common share to those used in
calculating income per diluted common share.
(In millions, except per-share amounts)
2012
2011
Diluted Basic
Diluted Basic
Income from continuing operations, net of tax
$294.6 $294.6
$367.2 $367.2
Noncontrolling interests
(1.6)(1.6)
(1.5)(1.5)
Income from continuing operations
attributable to Safeway Inc.
293.0 293.0
365.7 365.7
Distributed and undistributed earnings
allocated to participating securities
(2.7)(2.7)
(2.7)(2.7)
Income from continuing operations available
to common stockholders
290.3 290.3
363.0 363.0
Income from discontinued operations, net of
tax
303.5 303.5
151.0 151.0
Distributed and undistributed earnings
allocated to participating securities
(2.7)(2.7)
(1.1)(1.1)
Income from discontinued operations
available to common stockholders
300.8 300.8
149.9 149.9
Net income
$596.5 $596.5
$516.7 $516.7
Distributed and undistributed earnings
allocated to participating securities
(5.4)(5.4)
(3.8)(3.8)
Net income available to common
stockholders after earnings allocated to
participating securities
$591.1 $591.1
$512.9 $512.9
Weighted-average common shares
outstanding
245.6 245.6
343.4 343.4
Common share equivalents
0.3
0.4
Weighted-average shares outstanding
245.9
343.8
Earnings per common share:
Continuing operations
$1.18 $1.18
$1.06 $1.06
Discontinued operations
$1.22 $1.23
$0.43 $0.43
Total
$2.40 $2.41
$1.49 $1.49
Anti-dilutive shares totaling 7.8 million in 2013, 21.6 million in 2012 and 25.1 million in 2011 have been excluded from diluted weighted-
average shares outstanding.
90