Safeway 2013 Annual Report Download - page 27
Download and view the complete annual report
Please find page 27 of the 2013 Safeway annual report below. You can navigate through the pages in the report by either clicking on the pages listed below, or by using the keyword search tool below to find specific information within the annual report.-
 1
1 -
2
-
3
-
4
-
5
-
6
-
7
-
8
-
9
-
10
-
11
-
12
-
13
-
14
-
15
-
16
-
 17
17 -
 18
18 -
 19
19 -
 20
20 -
 21
21 -
 22
22 -
 23
23 -
 24
24 -
 25
25 -
 26
26 -
 27
27 -
 28
28 -
 29
29 -
 30
30 -
 31
31 -
 32
32 -
 33
33 -
 34
34 -
 35
35 -
 36
36 -
 37
37 -
38
-
39
-
40
-
41
-
42
-
43
-
44
-
45
-
46
-
47
-
48
-
49
-
50
-
51
-
52
-
53
-
54
-
55
-
56
-
57
-
58
-
59
-
60
-
61
-
62
-
63
-
64
-
65
-
66
-
67
-
68
-
69
-
70
-
71
-
72
-
73
-
74
-
75
-
76
-
77
-
78
-
79
-
80
-
81
-
82
-
83
-
84
-
85
-
86
-
87
-
88
-
89
-
90
-
91
-
92
-
93
-
94
-
95
-
96
-
97
-
98
-
99
-
100
-
101
-
102
-
103
-
104
-
105
-
106
-
107
-
108
-
109
-
110
-
111
-
112
-
113
-
114
-
115
-
116
-
117
-
118
-
119
-
120
-
121
-
122
-
123
-
124
-
125
-
126
-
127
-
128
-
129
-
130
-
131
-
132
-
133
-
134
-
135
-
136
-
137
-
138
-
139
-
140
-
141
-
142
-
143
-
144
-
145
-
146
-
147
-
148
-
149
-
150
-
151
-
152
-
153
-
154
-
155
-
156
-
157
-
158
-
159
-
160
-
161
-
162
-
163
-
164
-
165
-
166
-
167
-
168
-
169
-
170
-
171
-
172
-
173
-
174
-
175
-
176
-
177
-
178
-
179
-
180
-
181
-
182
-
183
-
184
-
185
-
186
-
187
-
188
 |
 |

Table of Contents
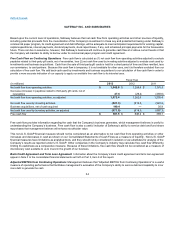
Shrink expense increased 19 basis points in 2013 and 13 basis point in 2012. In the second half of 2013, Safeway implemented a new
strategy which focuses more on increasing sales with less emphasis on controlling shrink. While Safeway anticipated some additional
shrink in 2013, the transition to the new strategy resulted in an unplanned level of shrink in the third quarter of 2013. We believe this initial
unplanned level for shrink was eliminated in the fourth quarter of 2013 and that shrink expense should be flat in 2014. Safeway's long-term
programs to control shrink expense include improved buying practices to prevent overstocking of inventory and increased security to reduce
theft.
Vendor allowances totaled $2.4 billion in 2013, $2.3 billion in 2012 and $2.2 billion in 2011. Vendor allowances can be grouped into the
following broad categories: promotional allowances, slotting allowances and contract allowances.
Promotional allowances make up the vast majority of all allowances. With promotional allowances, vendors pay Safeway to promote their
product. The promotion may be any combination of a temporary price reduction, a feature in print ads, a feature in a Safeway circular or a
preferred location in the store. The promotions are typically one to two weeks long.
Slotting allowances are a very small portion of total allowances. With slotting allowances, the vendor reimburses Safeway for the cost of
placing new product on the shelf. Safeway has no obligation or commitment to keep the product on the shelf for a minimum period.
Contract allowances make up the remainder of all allowances. Under a typical contract allowance, a vendor pays Safeway to keep product on
the shelf for a minimum period of time or when volume thresholds are achieved.
Promotional and slotting allowances are accounted for as a reduction in the cost of purchased inventory and are recognized when the related
inventory is sold. Contract allowances are recognized as a reduction in the cost of goods sold as volume thresholds are achieved or through
the passage of time.
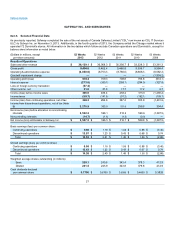
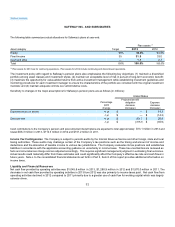
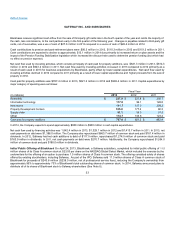
Operating and Administrative Expense Operating and administrative expense consists primarily of store occupancy costs and backstage
expenses, which, in turn, consist primarily of wages, employee benefits, rent, depreciation and utilities.
Operating and administrative expense was 24.51% of sales in 2013 compared to 24.27% of sales in 2012 and 24.78% in 2011.
Operating and administrative expense margin increased 24 basis points to 24.51% of sales in 2013 from 24.27% of sales in 2012 primarily
for the following reasons:
27