Safeway 2013 Annual Report Download - page 91
Download and view the complete annual report
Please find page 91 of the 2013 Safeway annual report below. You can navigate through the pages in the report by either clicking on the pages listed below, or by using the keyword search tool below to find specific information within the annual report.-
 1
1 -
2
-
3
-
4
-
5
-
6
-
7
-
8
-
9
-
10
-
11
-
12
-
13
-
14
-
15
-
16
-
17
-
18
-
19
-
20
-
21
-
22
-
23
-
24
-
25
-
26
-
27
-
28
-
29
-
30
-
31
-
32
-
33
-
34
-
35
-
36
-
37
-
38
-
39
-
40
-
41
-
42
-
43
-
44
-
45
-
46
-
47
-
48
-
49
-
50
-
51
-
52
-
53
-
54
-
55
-
56
-
57
-
58
-
59
-
60
-
61
-
62
-
63
-
64
-
65
-
66
-
67
-
68
-
69
-
70
-
71
-
72
-
73
-
74
-
75
-
76
-
77
-
78
-
79
-
80
-
 81
81 -
 82
82 -
 83
83 -
 84
84 -
 85
85 -
 86
86 -
 87
87 -
 88
88 -
 89
89 -
 90
90 -
 91
91 -
 92
92 -
 93
93 -
 94
94 -
 95
95 -
 96
96 -
 97
97 -
 98
98 -
 99
99 -
 100
100 -
 101
101 -
102
-
103
-
104
-
105
-
106
-
107
-
108
-
109
-
110
-
111
-
112
-
113
-
114
-
115
-
116
-
117
-
118
-
119
-
120
-
121
-
122
-
123
-
124
-
125
-
126
-
127
-
128
-
129
-
130
-
131
-
132
-
133
-
134
-
135
-
136
-
137
-
138
-
139
-
140
-
141
-
142
-
143
-
144
-
145
-
146
-
147
-
148
-
149
-
150
-
151
-
152
-
153
-
154
-
155
-
156
-
157
-
158
-
159
-
160
-
161
-
162
-
163
-
164
-
165
-
166
-
167
-
168
-
169
-
170
-
171
-
172
-
173
-
174
-
175
-
176
-
177
-
178
-
179
-
180
-
181
-
182
-
183
-
184
-
185
-
186
-
187
-
188
 |
 |
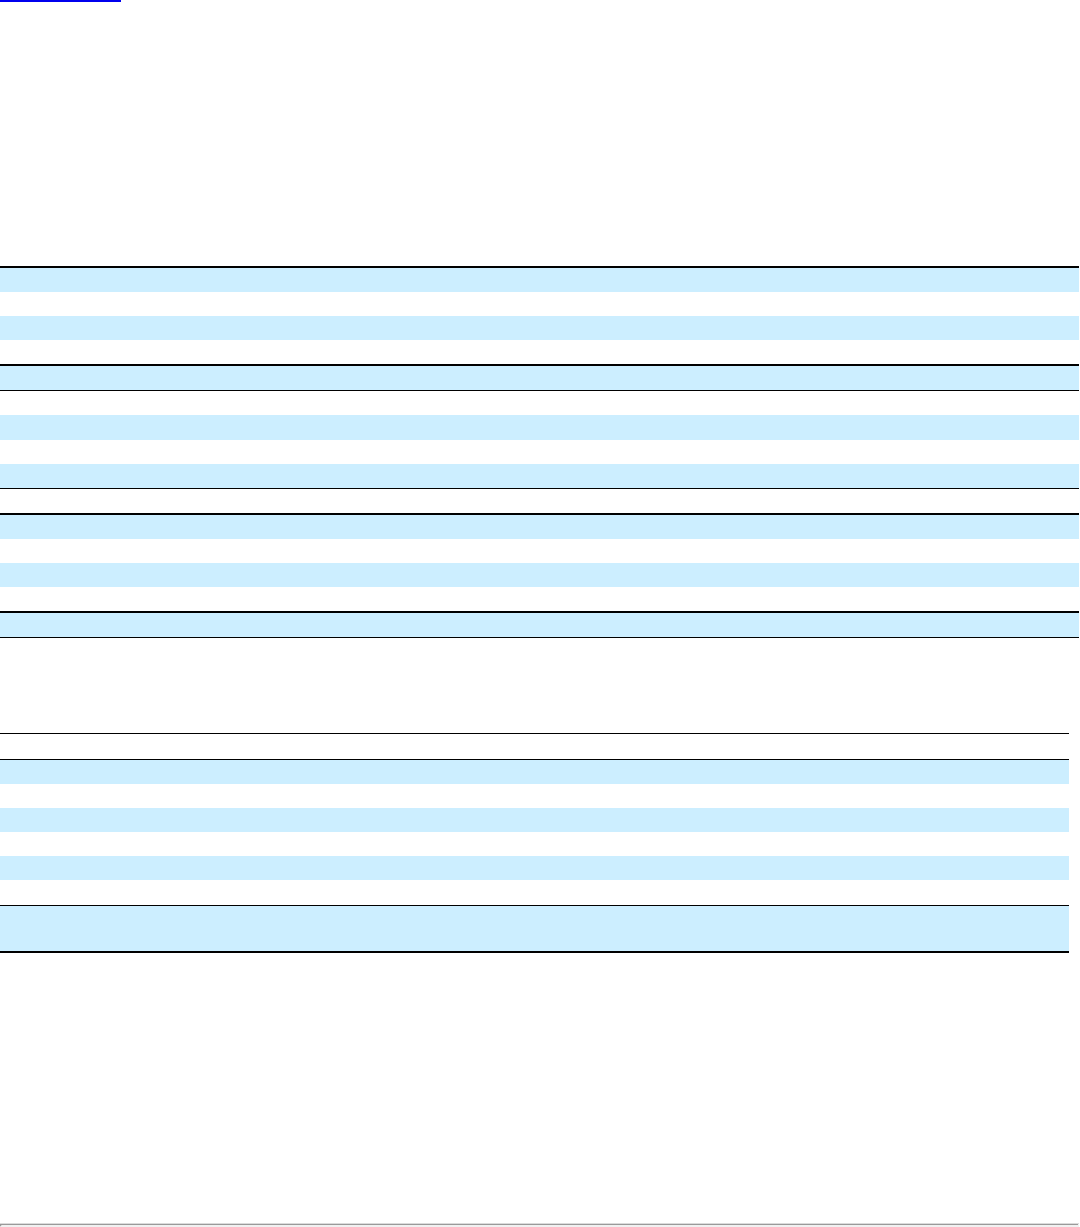
Table of Contents
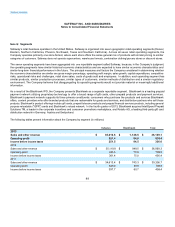
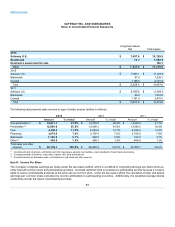
Long-lived Assets,
Net
Total Assets
2012
Safeway U.S. $7,991.1
$11,007.6
Blackhawk 67.0
1,528.1
Canada 1,166.5
2,121.3
Total $9,224.6
$14,657.0
2011
Safeway U.S. $8,395.6
$11,690.3
Blackhawk 60.6
1,291.8
Canada 1,181.4
2,091.5
Total $9,637.6
$15,073.6
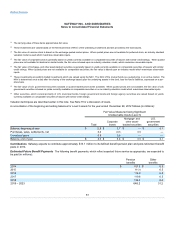
The following table presents sales revenue by type of similar product (dollars in millions):
2012
2011
Amount % of total
Amount % of total
Non-perishables (1)
$14,738.0 40.9%
$14,540.5 41.1%
Perishables (2)
12,548.1 34.8%
12,595.5 35.6%
Fuel
4,594.2 12.7%
4,230.4 12.0%
Pharmacy
2,755.4 7.6%
2,780.2 7.9%
Blackhawk
948.5 2.6%
743.3 2.1%
Other (3)
484.1 1.4%
466.8 1.3%
Total sales and other
revenue
$36,068.3 100.0%
$35,356.7 100.0%
(1) Consists primarily of grocery, soft drinks and other beverages, general merchandise, meal ingredients, frozen foods and snacks.
(2) Consists primarily of produce, meat, dairy, bakery, deli, floral and seafood.
(3) Consists primarily of wholesale sales, commissions on gift cards and other revenue.
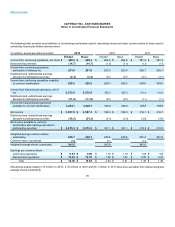
The Company computes earnings per share under the two-class method, which is a method of computing earnings per share when an
entity has both common stock and participating securities. Unvested restricted stock is considered a participating security because it contains
rights to receive nonforfeitable dividends at the same rate as common stock. Under the two-class method, the calculation of basic and diluted
earnings per common share excludes the income attributable to participating securities. Additionally, the weighted average shares
outstanding exclude the impact of participating securities.
89