Safeway 2013 Annual Report Download - page 32
Download and view the complete annual report
Please find page 32 of the 2013 Safeway annual report below. You can navigate through the pages in the report by either clicking on the pages listed below, or by using the keyword search tool below to find specific information within the annual report.-
 1
1 -
2
-
3
-
4
-
5
-
6
-
7
-
8
-
9
-
10
-
11
-
12
-
13
-
14
-
15
-
16
-
17
-
18
-
19
-
20
-
21
-
 22
22 -
 23
23 -
 24
24 -
 25
25 -
 26
26 -
 27
27 -
 28
28 -
 29
29 -
 30
30 -
 31
31 -
 32
32 -
 33
33 -
 34
34 -
 35
35 -
 36
36 -
 37
37 -
 38
38 -
 39
39 -
 40
40 -
 41
41 -
 42
42 -
43
-
44
-
45
-
46
-
47
-
48
-
49
-
50
-
51
-
52
-
53
-
54
-
55
-
56
-
57
-
58
-
59
-
60
-
61
-
62
-
63
-
64
-
65
-
66
-
67
-
68
-
69
-
70
-
71
-
72
-
73
-
74
-
75
-
76
-
77
-
78
-
79
-
80
-
81
-
82
-
83
-
84
-
85
-
86
-
87
-
88
-
89
-
90
-
91
-
92
-
93
-
94
-
95
-
96
-
97
-
98
-
99
-
100
-
101
-
102
-
103
-
104
-
105
-
106
-
107
-
108
-
109
-
110
-
111
-
112
-
113
-
114
-
115
-
116
-
117
-
118
-
119
-
120
-
121
-
122
-
123
-
124
-
125
-
126
-
127
-
128
-
129
-
130
-
131
-
132
-
133
-
134
-
135
-
136
-
137
-
138
-
139
-
140
-
141
-
142
-
143
-
144
-
145
-
146
-
147
-
148
-
149
-
150
-
151
-
152
-
153
-
154
-
155
-
156
-
157
-
158
-
159
-
160
-
161
-
162
-
163
-
164
-
165
-
166
-
167
-
168
-
169
-
170
-
171
-
172
-
173
-
174
-
175
-
176
-
177
-
178
-
179
-
180
-
181
-
182
-
183
-
184
-
185
-
186
-
187
-
188
 |
 |

Table of Contents
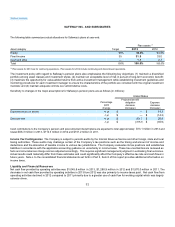
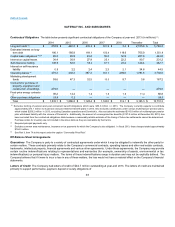
The following table summarizes actual allocations for Safeway’s plans at year-end:
Plan assets (1)
Asset category
Target
2012
Equity
65%
64.3%
Fixed income
35
33.0
Cash and other
—
2.7
Total
100%
100.0%
(1) Plan assets for 2013 are for continuing operations. Plan assets for 2012 include continuing and discontinued operations.
The investment policy with regard to Safeway’s pension plans also emphasizes the following key objectives: (1) maintain a diversified
portfolio among asset classes and investment styles; (2) maintain an acceptable level of risk in pursuit of long-term economic benefit;
(3) maximize the opportunity for value-added returns from active investment management while establishing investment guidelines and
monitoring procedures for each investment manager to ensure the characteristics of the portfolio are consistent with the original investment
mandate; and (4) maintain adequate controls over administrative costs.
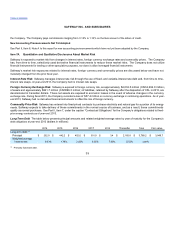
Sensitivity to changes in the major assumptions for Safeway's pension plans are as follows (in millions):
United States
Percentage
point
change
Projected benefit
obligation
decrease
(increase)
Expense
decrease
(increase)
Expected return on assets
+1 pt
$ —
$14.3
-1 pt
$ —
$(14.3)
Discount rate
+1 pt
$251.7
$28.9
-1 pt
$(315.7)
$(35.9)
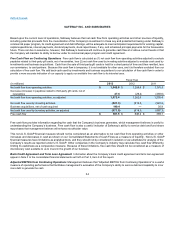
Cash contributions to the Company’s pension and post-retirement benefit plans are expected to total approximately $13.1 million in 2014 and
totaled $56.3 million in 2013, $110.3 million in 2012 and $151.2 million in 2011.
Income Tax Contingencies The Company is subject to periodic audits by the Internal Revenue Service and other foreign, state and local
taxing authorities. These audits may challenge certain of the Company’s tax positions such as the timing and amount of income and
deductions and the allocation of taxable income to various tax jurisdictions. The Company evaluates its tax positions and establishes
liabilities in accordance with the applicable accounting guidance on uncertainty in income taxes. These tax uncertainties are reviewed as
facts and circumstances change and are adjusted accordingly. This requires significant management judgment in estimating final outcomes.
Actual results could materially differ from these estimates and could significantly affect the Company’s effective tax rate and cash flows in
future years. Note L to the consolidated financial statements set forth in Part II, Item 8 of this report provides additional information on
income taxes.
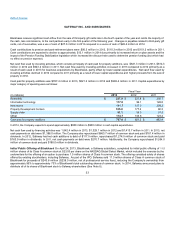
Net cash flow provided by operating activities was $1,045.8 million in 2013, $1,288.9 million in 2012 and $1,570.0 million in 2011. The
decrease in net cash flow provided by operating activities in 2013 from 2012 was due primarily to income taxes paid. Net cash flow from
operating activities declined in 2012 compared to 2011 primarily due to a greater use of cash flow for working capital which was largely
calendar driven.
32