Safeway 2013 Annual Report Download - page 26
Download and view the complete annual report
Please find page 26 of the 2013 Safeway annual report below. You can navigate through the pages in the report by either clicking on the pages listed below, or by using the keyword search tool below to find specific information within the annual report.-
 1
1 -
2
-
3
-
4
-
5
-
6
-
7
-
8
-
9
-
10
-
11
-
12
-
13
-
14
-
15
-
 16
16 -
 17
17 -
 18
18 -
 19
19 -
 20
20 -
 21
21 -
 22
22 -
 23
23 -
 24
24 -
 25
25 -
 26
26 -
 27
27 -
 28
28 -
 29
29 -
 30
30 -
 31
31 -
 32
32 -
 33
33 -
 34
34 -
 35
35 -
 36
36 -
37
-
38
-
39
-
40
-
41
-
42
-
43
-
44
-
45
-
46
-
47
-
48
-
49
-
50
-
51
-
52
-
53
-
54
-
55
-
56
-
57
-
58
-
59
-
60
-
61
-
62
-
63
-
64
-
65
-
66
-
67
-
68
-
69
-
70
-
71
-
72
-
73
-
74
-
75
-
76
-
77
-
78
-
79
-
80
-
81
-
82
-
83
-
84
-
85
-
86
-
87
-
88
-
89
-
90
-
91
-
92
-
93
-
94
-
95
-
96
-
97
-
98
-
99
-
100
-
101
-
102
-
103
-
104
-
105
-
106
-
107
-
108
-
109
-
110
-
111
-
112
-
113
-
114
-
115
-
116
-
117
-
118
-
119
-
120
-
121
-
122
-
123
-
124
-
125
-
126
-
127
-
128
-
129
-
130
-
131
-
132
-
133
-
134
-
135
-
136
-
137
-
138
-
139
-
140
-
141
-
142
-
143
-
144
-
145
-
146
-
147
-
148
-
149
-
150
-
151
-
152
-
153
-
154
-
155
-
156
-
157
-
158
-
159
-
160
-
161
-
162
-
163
-
164
-
165
-
166
-
167
-
168
-
169
-
170
-
171
-
172
-
173
-
174
-
175
-
176
-
177
-
178
-
179
-
180
-
181
-
182
-
183
-
184
-
185
-
186
-
187
-
188
 |
 |

Table of Contents
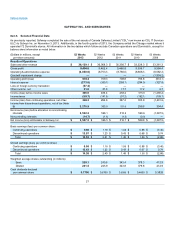
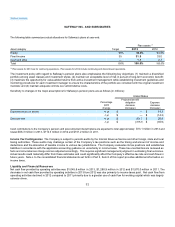
Sales increased 2.0% to $36,068.3 million in 2012 from $35,356.7 million in 2011. Fuel sales increased $363.8 million in 2012, as a
result of the average retail price per gallon of fuel increasing 2.3% and gallons sold increasing 5.8%. Identical-store sales, excluding fuel,
increased 0.8%, or $236 million, primarily due to inflation. Other revenue, primarily from gift and prepaid card sales increased $201 million.
New stores, net of store closures, increased sales by $205 million. Sales declined $254 million due to the disposition of Genuardi's stores.
Average transaction size increased during fiscal 2012, and transaction counts decreased.
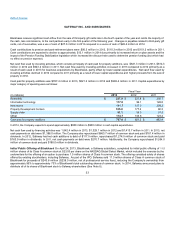
Gross Profit Gross profit represents the portion of sales revenue remaining after deducting the cost of goods sold during the period,
including purchase and distribution costs. These costs include inbound freight charges, purchasing and receiving costs, warehouse
inspection costs, warehousing costs and other costs associated with Safeway’s distribution network. Advertising and promotional expenses
are also a component of cost of goods sold. Additionally, all vendor allowances are classified as an element of cost of goods sold.
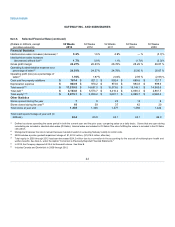
Gross profit margin was 26.27% of sales in 2013, 26.23% of sales in 2012 and 26.78% in 2011.
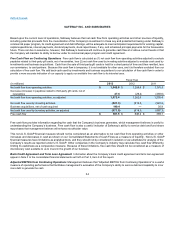
The gross profit margin increased four basis points to 26.27% of sales in 2013 from 26.23% of sales in 2012 primarily for the following
reasons:
Impact of fuel sales
Lower advertising expense
Changes in product mix
Increased LIFO income
Fuel partner discounts
Investments in price
Higher Blackhawk revenue (which has a lower gross margin than grocery sales)
Higher shrink expense
Other individually immaterial items
The gross profit margin decreased 55 basis points to 26.23% of sales in 2012 from 26.78% of sales in 2011 primarily for the following
reasons:
Basis-point
(decrease)
increase
Impact of fuel sales (35)
Investments in price (21)
Higher shrink expense (13)
Costs incurred to launch (9)
Lower LIFO expense 14
Other individually immaterial items 9
(55)
26