Safeway 2013 Annual Report Download - page 96
Download and view the complete annual report
Please find page 96 of the 2013 Safeway annual report below. You can navigate through the pages in the report by either clicking on the pages listed below, or by using the keyword search tool below to find specific information within the annual report.-
 1
1 -
2
-
3
-
4
-
5
-
6
-
7
-
8
-
9
-
10
-
11
-
12
-
13
-
14
-
15
-
16
-
17
-
18
-
19
-
20
-
21
-
22
-
23
-
24
-
25
-
26
-
27
-
28
-
29
-
30
-
31
-
32
-
33
-
34
-
35
-
36
-
37
-
38
-
39
-
40
-
41
-
42
-
43
-
44
-
45
-
46
-
47
-
48
-
49
-
50
-
51
-
52
-
53
-
54
-
55
-
56
-
57
-
58
-
59
-
60
-
61
-
62
-
63
-
64
-
65
-
66
-
67
-
68
-
69
-
70
-
71
-
72
-
73
-
74
-
75
-
76
-
77
-
78
-
79
-
80
-
81
-
82
-
83
-
84
-
85
-
 86
86 -
 87
87 -
 88
88 -
 89
89 -
 90
90 -
 91
91 -
 92
92 -
 93
93 -
 94
94 -
 95
95 -
 96
96 -
 97
97 -
 98
98 -
 99
99 -
 100
100 -
 101
101 -
 102
102 -
 103
103 -
 104
104 -
 105
105 -
 106
106 -
107
-
108
-
109
-
110
-
111
-
112
-
113
-
114
-
115
-
116
-
117
-
118
-
119
-
120
-
121
-
122
-
123
-
124
-
125
-
126
-
127
-
128
-
129
-
130
-
131
-
132
-
133
-
134
-
135
-
136
-
137
-
138
-
139
-
140
-
141
-
142
-
143
-
144
-
145
-
146
-
147
-
148
-
149
-
150
-
151
-
152
-
153
-
154
-
155
-
156
-
157
-
158
-
159
-
160
-
161
-
162
-
163
-
164
-
165
-
166
-
167
-
168
-
169
-
170
-
171
-
172
-
173
-
174
-
175
-
176
-
177
-
178
-
179
-
180
-
181
-
182
-
183
-
184
-
185
-
186
-
187
-
188
 |
 |

Table of Contents
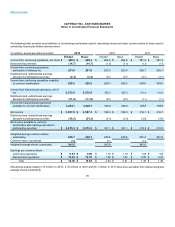
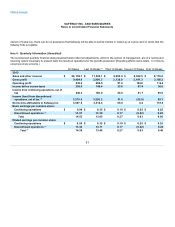
52 Weeks Last 16 Weeks (3) Third 12 Weeks
Second 12
Weeks First 12 Weeks
2012
Sales and other revenue $36,068.3 $11,220.8 $8,196.8 $8,489.2 $8,161.4
Gross profit 9,462.4 2,952.8 2,142.5 2,196.9 2,170.2
Operating profit 709.3 324.4 123.5 144.0 117.4
Income before income taxes 436.4 246.2 63.2 74.9 52.1
Income from continuing operations, net of tax 294.6 170.7 41.5 48.8 33.7
Income from discontinued operations, net of
tax (1) 303.5 74.7 115.5 74.1 39.3
Net income attributable to Safeway Inc. 596.5 245.4 157.0 122.7 72.9
Basic earnings per common share:
Continuing operations $1.18 $0.71 $0.17 $0.20 $0.12
Discontinued operations (1) 1.23 0.31 0.49 0.31 0.15
Total 2.41 1.02 0.66 0.51 0.27
Diluted earnings per common share:
Continuing operations $1.18 $0.71 $0.17 $0.20 $0.12
Discontinued operations (1) 1.22 0.31 0.49 0.31 0.15
Total 2.40 1.02 0.66 0.51 0.27
(1) See Note B, Discontinued Operations.
(2) In the fourth quarter of 2013, the Company recorded a loss on foreign currency translation of $57.4 million and an impairment of notes receivable of $30.0
million. Also the fourth quarter of 2013 included a tax expense of $19.8 million related to the Blackhawk IPO that should have been recorded in the second
quarter of 2013.
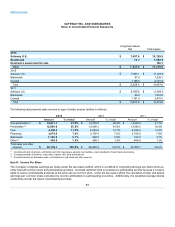
(3) In the fourth quarter of 2012, Safeway results included a pre-tax gain from legal settlements of $46.5 million.
94